Bank of America’s flagship model is flashing a ‘buy’ signal for stocks for the first time since January


The last time Bank of America Merrill Lynch’s flagship “Bull & Bear” indicator was flashing “Buy” was back on January 3 when the S&P 500 (^GSPC) closed at roughly 2,447 — or 19.5% ago.
On Friday, the S&P 500 stood near 2,925.
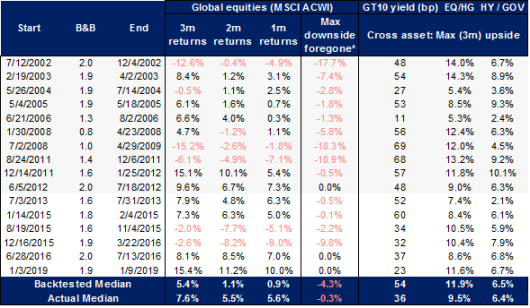
“Our flagship positioning model tumbles from 2.4 to 1.3 triggering a contrarian "buy signal" for risk assets, the first buy signal since January 3,” the Bank of America Merrill Lynch analysts, led by Michael Hartnett, chief investment strategist, in a note to clients.
This chart, courtesy of Bank of America Merrill Lynch, shows the history of the indicator.
In early January, stocks were still reeling from the monster December 2018 selloff. On Dec. 24, 2018, the S&P 500 fell 19.8% from its prior September 2018 peak. A decline of at least 20% from a stock or index’s prior peak is considered a bear market. Though in 2018’s case, the downturn was short-lived as stocks eclipsed their aforementioned September 2018 peak in late April and early May.
Even with an S&P 500 up 16.5% already in 2019, Bank of America is still bullish.
“[For 2019] we remain bullish on risk assets, particularly stocks & commodities driven by bearish positioning + bullish monetary policy (trade war has thus far been bullish via lower rates rather than recession),” the analysts wrote.
The analysts are less optimistic on 2020.
“[Our 2020 view is] bearish as recession/policy impotence/bond bubble risks induce Big Top in credit & equity prices as credit spreads trough & equity multiples peak,” they wrote.
Scott Gamm is a reporter at Yahoo Finance. Follow him on Twitter @ScottGamm.
More from Scott:
Trump slams Fed Chair Powell: 'He’s like a golfer who can’t putt'
S&P 500 will plunge another 15% by the end of this year: strategist
Why China’s falling yuan could be good for U.S. stocks: strategist
Verizon Q2 profit beats estimates, boosted by wireless growth
Here is how corporate stock buybacks are changing the earnings picture
Follow Yahoo Finance on Twitter, Facebook, Instagram, Flipboard, LinkedIn, and reddit.
