Trump leads in swing-state polls and is tied with Biden nationally

It's the moment you've all been waiting for: Today, 538 launched our interactive polling averages for the 2024 presidential general election. They show incumbent President Joe Biden and former President Donald Trump essentially tied in national polls and Trump with a tenuous lead in key swing states.
Specifically, as of April 25 at 9 a.m. Eastern, our national polling average shows 40.9 percent of likely voters would support Biden if the election were held today, while 41.6 percent would support Trump.
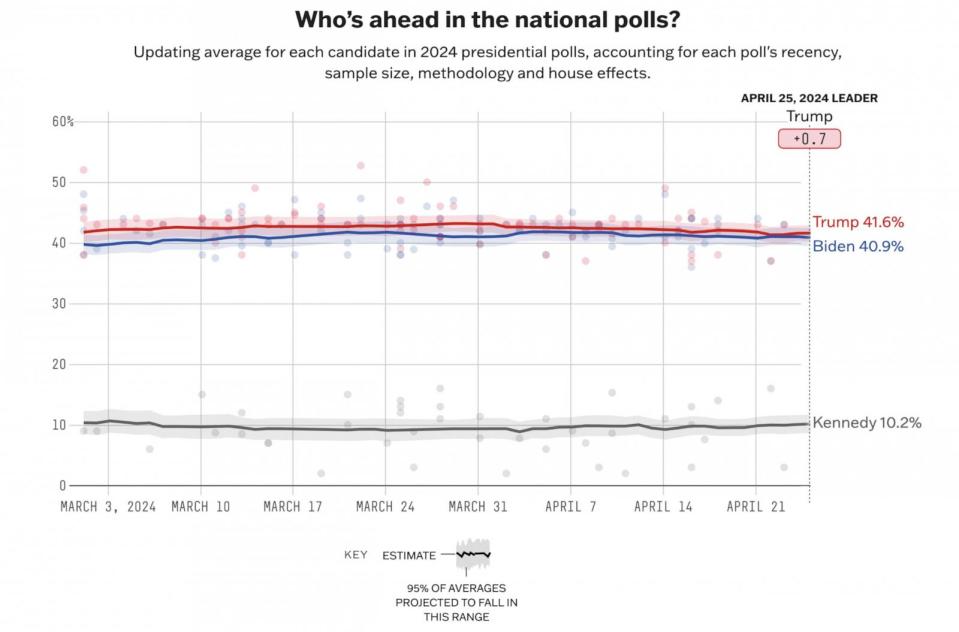
But there's considerable uncertainty in those numbers. To communicate this, we are also publishing uncertainty intervals for our horse-race averages for the first time. These intervals — represented by the red and blue shaded areas around each line — are kind of like the range of possible precipitation reported in a weather forecast, showing you could get anywhere from, say, 1 to 3 inches of rain in an upcoming storm.
Our uncertainty intervals take into account the variability of the polling data and the uncertainty we have about the various adjustments we are making, which are detailed later in this article. Right now, that interval shows that Biden's support could be anywhere between 39.4 and 42.2 percent, while Trump’s range is from 40.3 to 42.8 percent. Read on for more information about all the sources of uncertainty we are (and aren't) taking into account for these averages.
Our averages also show Trump leading in most swing states, though there is enough uncertainty that Biden could easily be ahead in enough to win the Electoral College. The table below shows each candidate's current estimated support and our uncertainty intervals for those numbers.
Biden is currently trailing Trump in the swing states
538′s polling averages for the 2024 presidential general election, accounting for pollster quality and house effects, poll recency, sample size, partisanship, mode and population effects, whether a poll tested named third-party candidates, and the trendline in national polls, as of April 25 at 9 a.m. Eastern
Biden margin | |||||
|---|---|---|---|---|---|
GA | 39.2% | 45.4% | -6.2 | -10.3 | -2.3 |
NV | 37.2 | 43.1 | -5.9 | -11.0 | -1.0 |
NC | 39.6 | 45.1 | -5.5 | -9.2 | -1.7 |
AZ | 38.8 | 43.4 | -4.6 | -9.1 | -0.3 |
MI | 40.4 | 41.9 | -1.5 | -5.4 | 2.5 |
PA | 41.6 | 42.8 | -1.2 | -5.3 | 3.1 |
WI | 41.2 | 41.3 | -0.1 | -4.0 | 3.7 |
National | 40.9 | 41.6 | -0.7 | -2.6 | 1.1 |
The lower and upper bounds for Biden margins are calculated as the 95% uncertainty intervals of our polling average’s simulations.
Source: Polls
Of course, the election will not be held today. While 538's new way of calculating polling averages takes into account sources of error that could affect those averages today — such as having a lot of polls from pollsters who tend to favor one party over another — we make no attempt to account for error that could arise from the large amount of time (six months!) remaining until the election, nor do we include the chance of an industrywide polling miss favoring either candidate.
Those are the types of potential errors we will account for in our election forecast, which will use several ingredients (including these averages) to predict the outcome of the November election and which we'll release in a couple of months. By contrast, our polling averages are intended to be our best guess at where public opinion stands right now, not a prediction for an election happening several months from now. We still urge you to exercise caution when reading early polls; they can change significantly between now and Election Day.
The rest of this article explains the methodology behind our polling averages: which polls we collect, how we weight and adjust them, and how we average them. This methodology is different from the one powering our other polling averages (such as for Biden's presidential job approval rating) in a few important ways, so it's worth spending a little time on the details.
Which polls we include
The building blocks of our polling averages are, of course, individual polls. Our presidential general election polling averages include all publicly available scientific polls that meet our methodological and ethical standards and test at least Biden versus Trump, though we prefer polls that test all major candidates who will be on the ballot in most states. We consider the Democratic and Republican presidential nominees to be "major" candidates by default, and include in that category any third-party candidate that is polling at least in the mid single digits nationally and will be on the ballot in most states, or who has a sizable chance of coming in second place in any state (think Evan McMullin in 2016).
That means we exclude polls that ask people how they would vote in hypothetical matchups, like if Michelle Obama were the Democratic nominee instead of Biden. We also don't use polls that ask about support for a "generic Democrat" or "generic Republican," nor do we include polls that ask voters if they support "someone else" for a third-party option.
If a pollster releases versions of a survey among multiple populations, our horse-race averages use the one with the most restrictive sample. That means we prefer polls of likely voters to polls of registered voters and polls of registered voters to polls of all adults. If a pollster releases multiple likely voter estimates, we average them together.
Some pollsters conduct polls that overlap with each other, such as Morning Consult. In these so-called "tracking polls," interviews from a certain period are incorporated into future polls, getting reweighted with different samples until they are too old and dropped from the analysis. But our averages include only polls with non-overlapping dates. How this works in practice is that we include the most recent iteration of each tracking poll, then include the next most recent version of that poll that doesn't overlap at all with the first poll, then include the next most recent version that doesn't overlap with that poll, etc.
Finally, to answer a frequently asked question, we do include partisan and internal campaign polls that get released to the public, with adjustments that aim to cancel out their partisan biases (see below). These polls make up a fairly small percentage of the data 538 aggregates, but they can still be useful for calculating trends in support over the course of the campaign.
How we weight polls
The next step is to calculate how much weight each poll should be given in our average. For really cool, but wonky, reasons you can read about in the footnotes,* our new presidential general election polling averages don't need to weight polls by several factors that we previously weighted on. Instead, a poll's weight is now a function of just two factors. (While our model does not weight for these old factors, they still get taken into account. See the footnote.)
The first is the 538 rating of the pollster that conducted the poll.** These ratings distill the empirical record and methodological transparency of each pollster into a single rating (from 0.5 to 3.0 stars) that tells our model how seriously to take its polls. Each poll gets a weight equal to the square root of its pollster's rating divided by the maximum three stars, then that weight is divided by the weight of the average pollster. The resulting pollster weight on a typical day usually ranges between a maximum of 1.3 and minimum of 0.5. If a pollster is new and does not have a 538 pollster rating, its polls get a weight equal to one.
Polls also receive reduced weight if the pollster who conducted them has released a lot of surveys in a short period of time. Specifically, each poll gets a weight equal to the square root of the number of polls released by its pollster in a 14-day window. We make this adjustment to prevent any given pollster from exerting too much control over the average.
Finally, we no longer explicitly weight polls by sample size, but we do limit the effective number of interviews per poll. Some polls contain tens of thousands of interviews (usually done very cheaply), and leaving these large numbers as they are would give those polls too much weight in our average. Therefore, we cap sample sizes at 5,000.
How we adjust and average polls
Let's zoom out for a second. Broadly speaking, the most commonly used polling averages for U.S. elections have followed one of three approaches:
Take a simple moving average of polls released over some number of previous days (the RealClearPolitics approach). Calculate a trendline through the polls using various statistical techniques, such as a polynomial trendline or Kalman filter (the HuffPost Pollster and The Economist approach). Combine these approaches, putting a certain amount of weight on the moving average and the rest on the fancier trend (historically, this has been the 538 approach).
There are a lot of benefits to this third option. The average-of-averages approach allows you to use predictions from the best parts of a slow-moving exponentially weighted moving average and a fast-moving polynomial trendline; it is computationally efficient to do so; and it's easy to explain this model to the public. It's also relatively trivial to tweak the model if we find something is working incorrectly.
However, this model has some shortcomings too. Our poll-averaging model for approval rating, favorability rating, primary elections and the generic congressional ballot is really a set of many different models that work together iteratively: First, we use models to reduce the weight on polls that are very old or have small sample sizes; then we use models to average polls and detect outliers; then we run new averaging models to detect house effects; and so on and so on, for nearly a dozen individual steps.
This can introduce some problems, some of them practical and others statistical, if a modeler is not careful. First, it's hard to account for uncertainty in the average, especially when using ad hoc weights for sample size and other factors. That's because we generate potential statistical error every time we move from one model to the next, and we have to run the program thousands of times every time we want to update! It's also a little more sensitive to noise than we'd like it to be, even when designed to accurately predict support for candidates in previous campaigns.
So this year, we're unveiling a brand-new methodology for averaging polls of the presidential general election. While the general approach is similar — we take polls, we weight them, we adjust them and we average them together — the various steps of our model no longer happen iteratively, but rather simultaneously in the same combined model.
Our new model is formally called a Bayesian multi-level dynamic linear model, or a "state-space" model depending on your persuasion. The model is fit using a statistical method called Markov chain Monte Carlo — a mathematical approach to figuring out the likely values of a bunch of different parameters in one huge equation.
Oversimplifying a bit, you can think of our presidential general-election polling average as one giant model that is trying to predict the results of polls we collect based on (1) the overall state of public opinion on any given day and (2) various factors that could have influenced the result of a particular poll. For example:
The polling firm responsible for the poll: The specific ways in which a pollster collects and analyzes its data can lead to systematic differences between its polls and other pollsters' polls. For example, some pollsters, such as the Trafalgar Group, usually underestimate support for Democrats, while other pollsters, like Center Street PAC, overestimate them. We call these differences "house effects," and we apply a house-effect adjustment to ensure they're not biasing our averages. The mode used to conduct the poll: Different groups of people answer polls in different ways. Young people are likelier to be online, for instance, and phone polls reach older, whiter voters more readily. If pollsters aren't careful, these biases can creep into all polls conducted using a single mode. So we apply a mode-effects adjustment to correct for those biases before we aggregate those surveys. Whether the poll sampled likely voters, registered voters or all adults: Our presidential general-election averages apply a likely-voter adjustment to all polls of registered voters and adults, since, at the end of the day, we're not interested in Trump's and Biden's support among people who aren't going to turn out. Whether the poll included response options for third-party candidates or forced respondents to pick between Biden and Trump: This year, independent candidate Robert F. Kennedy Jr. is likely to make the ballot in most, if not all states, and since he's polling at around 10 percent according to our average, polls that don't include him as an option are likely overestimating support for Biden and Trump. So we apply a third-party adjustment to polls that don't ask about third parties. Whether the poll was conducted by a campaign or other partisan organization: We apply a partisanship adjustment to account for this. Our initial guess is partisan polls overestimate support for the allied candidate by 2 percentage points, but this effect will shrink (or grow) if the data reveals a different answer.
Our prediction for a given poll also accounts for the value of the polling average on the day it was conducted. That's because if overall support for a candidate is 50 percent, we should expect polls from that day to reveal higher support than if they were at, say, 30 percent overall support. This also means the model implicitly puts less weight on polls that look like huge outliers, after adjusting for all the factors above.
At the state level, we consider one more variable: the national political environment. Historically, candidates' support has tended to rise and fall across the country more or less uniformly. In other words, if a candidate slips in national polls, they have probably slipped in state polls by a similar amount (our nation is made up of the states, after all). Our trendline adjustment takes this into account. Every day, movement in a given state's polling average is a function of changes in both polls of that state and national polls. The relationship also works the other way — if we see a flood of state polls with Biden improving by 3 points, his national average will increase, too.
But if our prediction for the support of Candidate X in State Y on Day Z depends on the average for that X-Y-Z combination, that brings up the question of how exactly the national and state averages are being calculated. We use a random walk to model averages over time. In essence, we tell our computers that support for every candidate in state and national polls should start at some point on Day 1 and move by some amount on average each subsequent day. Support for Biden might move by 0.1 points on Day 2, -0.2 points on Day 3, 0.4 points on Day 4, 0 points on Day 5, and so on and so on. Every time we run our model, it determines the likeliest values of these daily changes for each candidate nationally and in each state, while adjusting polls for all the factors mentioned above.
We also account for the amount of random error in each poll. This is noise that goes above and beyond the patterns of bias we can account for with the adjustments listed above. The primary source of this noise is sampling error, derived from the number of interviews a pollster does: A larger sample size means less variance due to "stochasticity" (random weirdness) in a poll's sample. But there is also non-sampling error in each poll — a blanket term encompassing any additional noise that could be a result of faulty weights, certain groups not picking up the phone, a bad questionnaire design or really anything else that we haven't added explicit adjustment factors for. Our model decides how much non-sampling error is present across the polls by adding an additional constant to the standard deviation implied by each poll's sample size via the sum of squares formula (with the model deciding how large that constant should be). Considering all these factors together, the full equation behind our model looks like this.
coming soon pic.twitter.com/lwKfScmZkh
— G Elliott Morris (@gelliottmorris) April 18, 2024
Two more short notes: First, we also tell the model to expect support for one candidate to move inversely with support for the other. If Biden makes gains in Wisconsin, it's probably coming at Trump's expense. While this correlation is more important for forecasting outcomes than averaging polls (it changes average support for Biden by just 0.1 points today), we find that our models run much faster if they take this into account. The exact correlation between the candidates is also a parameter in the model; we start with a strong prior that extra Democratic votes cost the Republicans (and vice versa), but the data will determine how strong the penalty is.
Second, our model no longer directly measures each state's "elasticity," or how malleable its public opinion is compared with the nation as a whole. However, the model implicitly accounts for this by letting the day-to-day variability in candidates' averages change by different amounts in different states.
How we account for uncertainty
Our new model also lets us account for uncertainty in the polling average in a very straightforward way. Imagine we are not calculating support for Biden in Wisconsin one single time, but thousands of times, where each time we see what his support would be if the data and parameters of our model had different values. What if the latest poll from The New York Times/Siena College had Biden's support 3 points higher, as a poll of 1,000 people would be expected to have about 5 percent of the time? Or what if the third-party adjustment were smaller?
Our model answers these questions by simulating thousands of different polling averages each time it runs. That, in turn, lets us show uncertainty intervals directly on the average — to our knowledge, the first time a general-election polling average has done so since HuffPost Pollster in 2016.
Again, though, these uncertainty intervals aren't showing you the uncertainty that arises from the possibility of an industrywide polling miss. That is the job of our forecast. The uncertainty in our averages answers the question, "How different could support for each candidate be in the average poll today if we observed more polls with slightly different results?", while the uncertainty in our forecast answers the question, "How different could each candidate's actual support be from the polls?"
Conclusion
I should note that variations of this model have been proposed by political scientists and statisticians for a few decades. (The following paragraph is not exhaustive, but should give you a good sense of the history of this approach.) By my research, Robert Erikson and Christopher Wlezien were the first to model support for candidates with house effects and as a smooth function of time over the campaign. Political scientist Simon Jackman later formalized a Bayesian time-series model of polls with house effects for Australian elections. Statisticians Kari Lock and Andrew Gelman employed a time-series model of polls as part of a paper forecasting election outcomes with polls and other data. Political scientist/survey statistician/pollster Drew Linzer combined aspects of these and other approaches in a Bayesian dynamic linear model of state and national polls of 2012 general election. And I worked with Gelman and statistician Merlin Heidemanns to add additional poll-level adjustments as well as other factors to model the 2020 general election in this way.
538's new presidential general-election polling average goes one step beyond these previous approaches by modeling support for multiple candidates across geographies simultaneously and adding a few additional adjustments that have not been attempted before in the fully Bayesian context.
That's it for now! If I've done my job well, hopefully you can see how this new approach closely resembles our original dual-purpose model of models, but in one neat package. If you see any polls that are missing, or spot a methodological bug (these things do happen when we launch new averages, especially with models of this level of sophistication), hit us up with an email.
Footnotes
*More on this in the "How we adjust and average polls" section, but the basic reason is that our new model is not a mix of a weighted average and polynomial trendline — methods that need to be told explicitly which observations are subject to less noise — but rather a Bayesian time series model that directly takes the observation noise in the poll into account. So we no longer need to weight on sample size, poll recency and the degree to which a poll is an outlier; the model handles that stuff for us on its own.
**As a methodological matter, we think how to best integrate pollster weights into an aggregation model is an open debate. (In fact, one statistician told me we shouldn't weight to pollster effects at all — instead we should create complicated meta-models of polling accuracy across many different contests simultaneously and inject the estimated uncertainty and bias of each pollster directly into our model. Unfortunately, this is not computationally feasible for the type of live-updating statistical model we want to publish.) We tried a few more complicated methods — such as adjusting the effective sample size of each poll to match how accurate we expected it to be — but they did not perform meaningfully better than more parsimonious approaches. As a practical matter, what matters more than how you weight polls based on their quality is that you try to account for quality at all.
Trump leads in swing-state polls and is tied with Biden nationally originally appeared on abcnews.go.com

