The XpresSpa Group (NASDAQ:XSPA) Share Price Is Down 99% So Some Shareholders Are Very Salty

Want to participate in a short research study? Help shape the future of investing tools and you could win a $250 gift card!
XpresSpa Group, Inc. (NASDAQ:XSPA) shareholders are doubtless heartened to see the share price bounce 142% in just one week. But spare a thought for the long term holders, who have held the stock as it bled value over the last five years. Like a ship taking on water, the share price has sunk 99% in that time. While the recent increase might be a green shoot, we're certainly hesitant to rejoice. The real question is whether the business can leave its past behind and improve itself over the years ahead.
We really hope anyone holding through that price crash has a diversified portfolio. Even when you lose money, you don't have to lose the lesson.
View our latest analysis for XpresSpa Group
XpresSpa Group isn't currently profitable, so most analysts would look to revenue growth to get an idea of how fast the underlying business is growing. When a company doesn't make profits, we'd generally expect to see good revenue growth. That's because fast revenue growth can be easily extrapolated to forecast profits, often of considerable size.
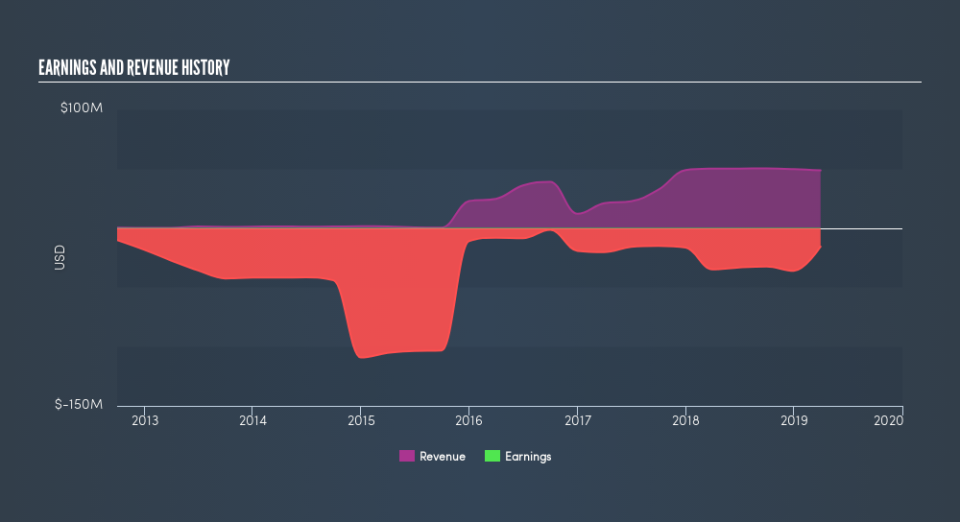
In the last half decade, XpresSpa Group saw its revenue increase by 48% per year. That's well above most other pre-profit companies. So it's not at all clear to us why the share price sunk 64% throughout that time. You'd have to assume the market is worried that profits won't come soon enough. While there might be an opportunity here, you'd want to take a close look at the balance sheet strength.
You can see below how earnings and revenue have changed over time (discover the exact values by clicking on the image).
You can see how its balance sheet has strengthened (or weakened) over time in this free interactive graphic.
A Different Perspective
XpresSpa Group shareholders are down 26% for the year, but the market itself is up 6.9%. However, keep in mind that even the best stocks will sometimes underperform the market over a twelve month period. However, the loss over the last year isn't as bad as the 64% per annum loss investors have suffered over the last half decade. We would want clear information suggesting the company will grow, before taking the view that the share price will stabilize. You might want to assess this data-rich visualization of its earnings, revenue and cash flow.
If you would prefer to check out another company -- one with potentially superior financials -- then do not miss this free list of companies that have proven they can grow earnings.
Please note, the market returns quoted in this article reflect the market weighted average returns of stocks that currently trade on US exchanges.
We aim to bring you long-term focused research analysis driven by fundamental data. Note that our analysis may not factor in the latest price-sensitive company announcements or qualitative material.
If you spot an error that warrants correction, please contact the editor at editorial-team@simplywallst.com. This article by Simply Wall St is general in nature. It does not constitute a recommendation to buy or sell any stock, and does not take account of your objectives, or your financial situation. Simply Wall St has no position in the stocks mentioned. Thank you for reading.
