The stock market just passed a big test in determining whether its secular bull run will continue, but risks remain, Bank of America says

The secular bull market that started in 2013 is still intact for the S&P 500, according to Bank of America.
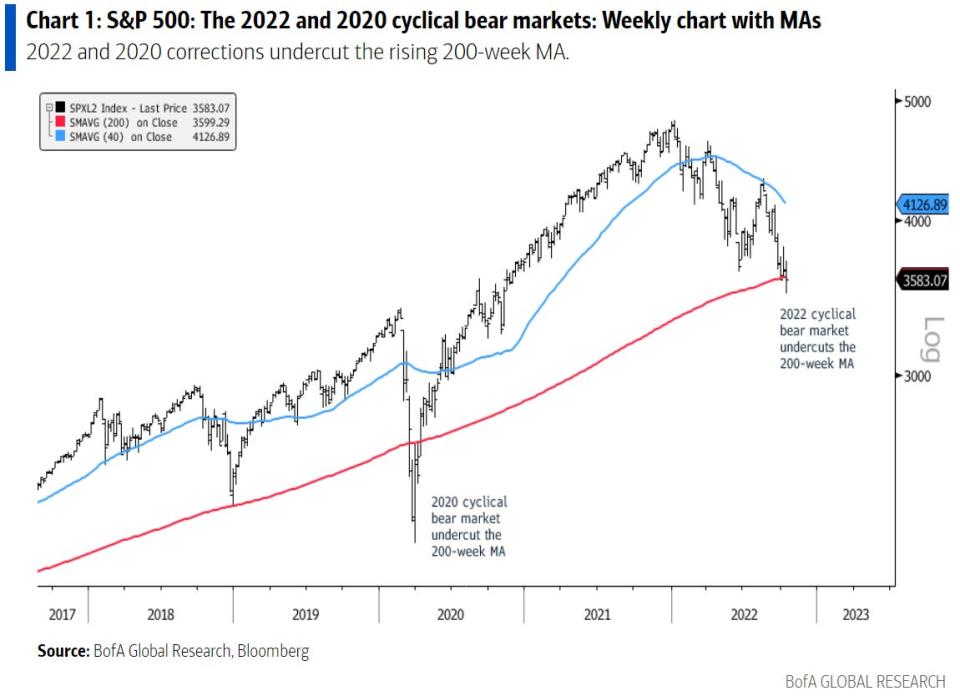
The bank said the secular bull just passed a major test when it bounced off of its rising 200-week moving average.
Here's what the stock market needs to do next to confirm that the current market sell-off is nothing more than a cyclical bear market.
The almost 10-year old secular bull market remains intact despite this year's 25% decline in the S&P 500, Bank of America said in a note on Monday.
The bank highlighted that the S&P 500 just passed a very important test after it bounced off of its 200-week moving average. That's a level that has proven to be a "stress test level" for prior cyclical bear markets that occurred during longer-term bull market runs.
"The five prior cyclical bear markets of 20% or more during secular bull markets ending in October 1957, June 1962, August 1982, December 1987 and March 2020 saw the S&P 500 test, undercut or spend some time below its rising 200-week moving average," BofA's Stephen Suttmeier said.
The rising 200-week moving average also marked the bottom during the S&P 500's December 2018 decline of just under 20%.
The S&P 500's 200-week moving average currently sits at 3,605, and the index has flirted with that level for the past three weeks, closing above it in two out of those three weeks.
But now the index has a more important test ahead of itself to confirm that the cyclical bear market will eventually end and make way for a continuation of the current secular bull market, according to the note.
"After undercutting the 200-week moving average, regaining the 40-week moving average is critical for the S&P 500 to maintain its secular bull market and avoid a shift into a secular bear market. The failure to reclaim the 40-week moving average after correcting to or below the 200-week MA is a secular bear market pattern," Suttmeier explained.
The S&P 500's 40-week moving average currently sits at 4,102, which represents potential upside of 11% from current levels. Helping the S&P 500 heading into year-end is favorable seasonal patterns, with stocks usually performing well in the fourth quarter, and with favorable seasonals following the mid-term elections.
"If the S&P 500 cannot regain its 40-week MA during the best part of the Presidential Cycle, we would view this as a risk to the secular bull market," Suttmeier said.
He sees potential for a tactical bearish sell-off to as low as 3,200 if the 3,700 level continues to act as strong resistance for the index. A decline to that level represents potential downside of 13% from current levels.
Read the original article on Business Insider
