What Is Regis Resources's (ASX:RRL) P/E Ratio After Its Share Price Rocketed?

Regis Resources (ASX:RRL) shareholders are no doubt pleased to see that the share price has had a great month, posting a 31% gain, recovering from prior weakness. The full year gain of 16% is pretty reasonable, too.
Assuming no other changes, a sharply higher share price makes a stock less attractive to potential buyers. While the market sentiment towards a stock is very changeable, in the long run, the share price will tend to move in the same direction as earnings per share. The implication here is that deep value investors might steer clear when expectations of a company are too high. Perhaps the simplest way to get a read on investors' expectations of a business is to look at its Price to Earnings Ratio (PE Ratio). Investors have optimistic expectations of companies with higher P/E ratios, compared to companies with lower P/E ratios.
Check out our latest analysis for Regis Resources
How Does Regis Resources's P/E Ratio Compare To Its Peers?
Regis Resources's P/E of 15.18 indicates some degree of optimism towards the stock. The image below shows that Regis Resources has a higher P/E than the average (9.5) P/E for companies in the metals and mining industry.
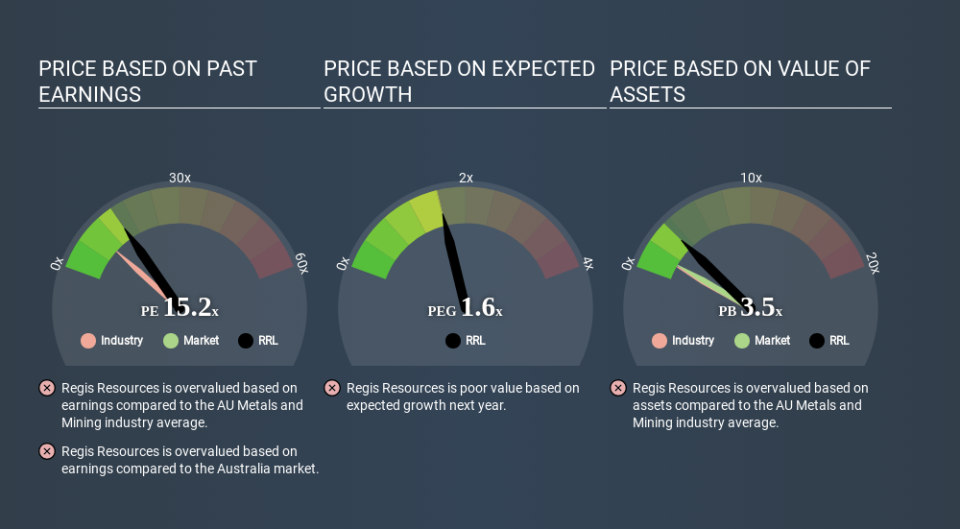
Regis Resources's P/E tells us that market participants think the company will perform better than its industry peers, going forward. Clearly the market expects growth, but it isn't guaranteed. So investors should delve deeper. I like to check if company insiders have been buying or selling.
How Growth Rates Impact P/E Ratios
P/E ratios primarily reflect market expectations around earnings growth rates. When earnings grow, the 'E' increases, over time. That means unless the share price increases, the P/E will reduce in a few years. So while a stock may look expensive based on past earnings, it could be cheap based on future earnings.
Regis Resources increased earnings per share by 5.1% last year. And earnings per share have improved by 11% annually, over the last three years.
A Limitation: P/E Ratios Ignore Debt and Cash In The Bank
One drawback of using a P/E ratio is that it considers market capitalization, but not the balance sheet. So it won't reflect the advantage of cash, or disadvantage of debt. Hypothetically, a company could reduce its future P/E ratio by spending its cash (or taking on debt) to achieve higher earnings.
Such spending might be good or bad, overall, but the key point here is that you need to look at debt to understand the P/E ratio in context.
So What Does Regis Resources's Balance Sheet Tell Us?
Since Regis Resources holds net cash of AU$159m, it can spend on growth, justifying a higher P/E ratio than otherwise.
The Verdict On Regis Resources's P/E Ratio
Regis Resources has a P/E of 15.2. That's around the same as the average in the AU market, which is 15.0. Earnings improved over the last year. And the healthy balance sheet means the company can sustain growth. But the P/E suggests shareholders have some doubts. What we know for sure is that investors have become more excited about Regis Resources recently, since they have pushed its P/E ratio from 11.6 to 15.2 over the last month. For those who prefer to invest with the flow of momentum, that might mean it's time to put the stock on a watchlist, or research it. But the contrarian may see it as a missed opportunity.
When the market is wrong about a stock, it gives savvy investors an opportunity. As value investor Benjamin Graham famously said, 'In the short run, the market is a voting machine but in the long run, it is a weighing machine. So this free report on the analyst consensus forecasts could help you make a master move on this stock.
You might be able to find a better buy than Regis Resources. If you want a selection of possible winners, check out this free list of interesting companies that trade on a P/E below 20 (but have proven they can grow earnings).
If you spot an error that warrants correction, please contact the editor at editorial-team@simplywallst.com. This article by Simply Wall St is general in nature. It does not constitute a recommendation to buy or sell any stock, and does not take account of your objectives, or your financial situation. Simply Wall St has no position in the stocks mentioned.
We aim to bring you long-term focused research analysis driven by fundamental data. Note that our analysis may not factor in the latest price-sensitive company announcements or qualitative material. Thank you for reading.
