PubMatic's (NASDAQ:PUBM) Reasonable Valuation Backs up its Relative Strength
This article originally appeared on Simply Wall St News.
PubMatic, Inc. ( NASDAQ:PUBM ) is one growth stock that has displayed relative strength over the last few weeks. This is notable as a lot of popular growth stocks have been particularly weak this month. We decided to calculate an estimate of PubMatic’s intrinsic value to see if there may be an opportunity for investors.
We generally believe that a company's value is the present value of all of the cash it will generate in the future. However, a DCF is just one valuation metric among many, and it is not without flaws. If you still have some burning questions about this type of valuation, take a look at the Simply Wall St analysis model .
See our latest analysis for PubMatic
The method
We are using a two-stage DCF model, which, as the name states, takes into account two stages of growth. The first stage is generally a higher growth period which levels off heading towards the terminal value, captured in the second 'steady growth' period. To start off with, we need to estimate the next ten years of cash flows. Where possible we use analyst estimates, but when these aren't available we extrapolate the previous free cash flow (FCF) from the last estimate or reported value. We assume companies with shrinking free cash flow will slow their rate of shrinkage, and that companies with growing free cash flow will see their growth rate slow, over this period. We do this to reflect that growth tends to slow more in the early years than it does in later years.
A DCF is all about the idea that a dollar in the future is less valuable than a dollar today, so we discount the value of these future cash flows to their estimated value in today's dollars:
10-year free cash flow (FCF) estimate
2022 | 2023 | 2024 | 2025 | 2026 | 2027 | 2028 | 2029 | 2030 | 2031 | |
Levered FCF ($, Millions) | US$75.2m | US$86.5m | US$94.7m | US$101.7m | US$107.5m | US$112.4m | US$116.7m | US$120.4m | US$123.9m | US$127.1m |
Growth Rate Estimate Source | Analyst x2 | Analyst x2 | Est @ 9.6% | Est @ 7.31% | Est @ 5.7% | Est @ 4.58% | Est @ 3.79% | Est @ 3.24% | Est @ 2.86% | Est @ 2.59% |
Present Value ($, Millions) Discounted @ 5.6% | US$71.2 | US$77.6 | US$80.5 | US$81.8 | US$81.9 | US$81.1 | US$79.8 | US$78.0 | US$76.0 | US$73.8 |
("Est" = FCF growth rate estimated by Simply Wall St)
Present Value of 10-year Cash Flow (PVCF) = US$781m
After calculating the present value of future cash flows in the initial 10-year period, we need to calculate the Terminal Value, which accounts for all future cash flows beyond the first stage.The Gordon Growth formula is used to calculate Terminal Value at a future annual growth rate equal to the 5-year average of the 10-year government bond yield of 2.0%. We discount the terminal cash flows to today's value at a cost of equity of 5.6%.
Terminal Value (TV) = FCF 2031 × (1 + g) ÷ (r – g) = US$127m× (1 + 2.0%) ÷ (5.6%– 2.0%) = US$3.6b
Present Value of Terminal Value (PVTV) = TV / (1 + r) 10 = US$3.6b÷ ( 1 + 5.6%) 10 = US$2.1b
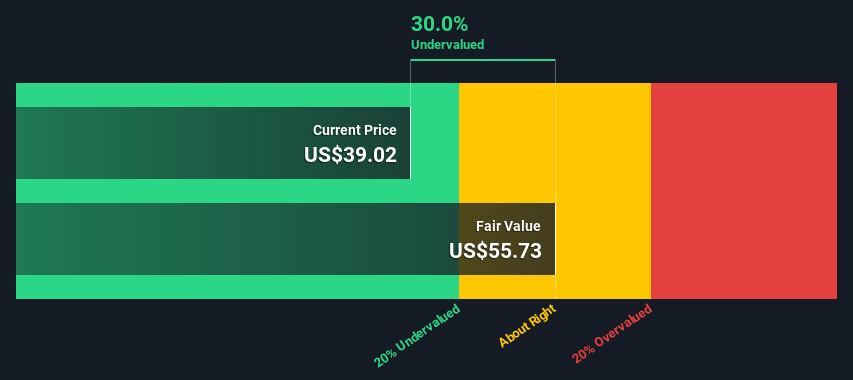
The total value, or equity value, is then the sum of the present value of the future cash flows,which in this case is US$2.9b.The last step is to then divide the equity value by the number of shares outstanding.Relative to the current share price of US$39.0, the company appearsa touch undervaluedat a 30% discount to where the stock price trades currently.Valuations are imprecise instruments though, rather like a telescope - move a few degrees and end up in a different galaxy. Do keep this in mind.
Important assumptions
The most important inputs to a discounted cash flow are the discount rate and of course the actual cash flows. Part of investing is coming up with your own evaluation of a company's future performance, so try the calculation yourself and check your own assumptions. The DCF also does not consider the possible cyclicality of an industry, or a company's future capital requirements, so it does not give a full picture of a company's potential performance. Given that we are looking at PubMatic as potential shareholders, the cost of equity is used as the discount rate, rather than the cost of capital (or weighted average cost of capital, WACC) which accounts for debt. In this calculation we've used 5.6%, which is based on a levered beta of 0.827. Beta is a measure of a stock's volatility, compared to the market as a whole. We get our beta from the industry average beta of globally comparable companies, with an imposed limit between 0.8 and 2.0, which is a reasonable range for a stable business.
Next Steps:
On the face of it, PubMatic appears to be trading at a modest 30% discount to its intrinsic value, which may give investors a margin of safety. However, this doesn’t mean the stock is not without its risks.
PubMatic is quite a small company - the market cap is just $2 billion. Companies of this size usually have volatile cash flows and stock prices. The company has been profitable in each of the last nine quarters, but revenues have been somewhat lumpy from one quarter to the next. If this continues the share price is likely to remain quite volatile.
PubMatic operates in the digital advertising industry which is evolving rapidly. This is positive as it means new opportunities are constantly arising. But it does also mean that every company is at risk of being disrupted.
Ultimately it will be earnings growth that drives returns for investors. If you are interested in PubMatic you can stay up to date with growth forecasts with this free analyst growth expectation chart .
PS. The Simply Wall St app conducts a discounted cash flow valuation for every stock on the NASDAQGM every day. If you want to find the calculation for other stocks just search here .
Have feedback on this article? Concerned about the content? Get in touch with us directly. Alternatively, email editorial-team@simplywallst.com
Simply Wall St analyst Richard Bowman and Simply Wall St have no position in any of the companies mentioned. This article is general in nature. We provide commentary based on historical data and analyst forecasts only using an unbiased methodology and our articles are not intended to be financial advice. It does not constitute a recommendation to buy or sell any stock and does not take account of your objectives, or your financial situation. We aim to bring you long-term focused analysis driven by fundamental data. Note that our analysis may not factor in the latest price-sensitive company announcements or qualitative material.
