EUR/USD Consolidating Above 2-Year Low at 1.0758
The Euro is edging higher against the U.S. Dollar on Tuesday as prices consolidate for a third session around the March 7 bottom at 1.0806, slightly above a multi-year low reached last week at 1.0758.
A divergence in monetary policy between the U.S. Federal Reserve and the European Central Bank (ECB) is helping to drive the price action. Simply stated, the Fed is hawkish and the ECB is dovish.
At 13:42 GMT, the EUR/USD is at 1.0797, up 0.0017 or +0.15%. On Monday, the Invesco CurrencyShares Euro Trust ETF (FXE) settled at 99.92, down $0.37 or -0.37%.
Expectations that the Fed will tighten its monetary policy have continued to provide support for the dollar, while the ECB said last week that it doesn’t know when it will begin raising interest rates.
Higher U.S. Treasury yields are getting most of the credit for driving the U.S. Dollar up against the Euro, but the strength of the U.S. economy is another factor. While the U.S. economy thrives, the Euro Zone economy is facing a wall of uncertainty due to the devastation caused by the war in Ukraine.
Daily Swing Chart Technical Analysis
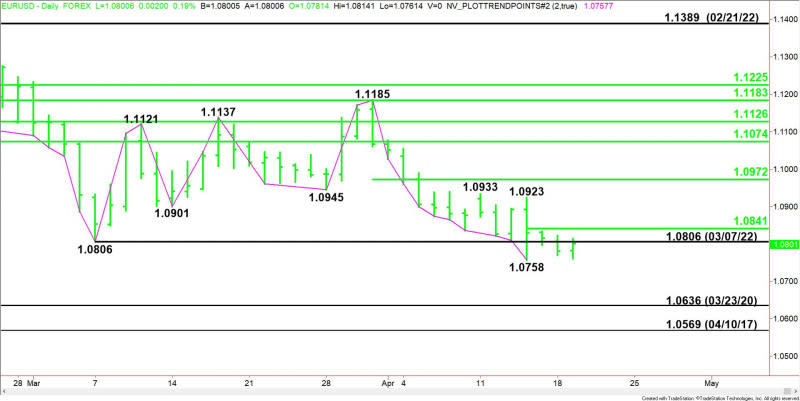
The main trend is down according to the daily swing chart. A trade through 1.0758 will signal a resumption of the downtrend. A move through 1.1185 will change the main trend to up.
The minor trend is also down. A trade through 1.0923 will change the minor trend to up. This will also shift momentum to the upside.
The minor range is 1.0923 to 1.0758. Its pivot at 1.0841 is the nearest resistance. The second minor range is 1.1185 to 1.0758. Its 50% level at 1.0972 is additional resistance.
Daily Swing Chart Technical Analysis
The direction of the EUR/USD into the close on Tuesday is likely to be determined by trader reaction to the pivot at 1.0841.
Bearish Scenario
A sustained move under 1.0841 will mean the EUR/USD is still in the strong hands of sellers. The first downside target is last week’s two-year low at 1.0758.
Taking out 1.0758 could trigger an acceleration to the downside, or lead to a slow grind into the next support level at 1.0636. This is the “pandemic bottom” from March 23, 2020.
Bullish Scenario
A sustained move over 1.0841 will signal the return of buyers. It may only be short-covering at first, but if it is strong enough then look for a potential surge into the pair of minor tops at 1.0923 and 1.0933, followed by the 50% level at 1.0972.
For a look at all of today’s economic events, check out our economic calendar.
This article was originally posted on FX Empire
