E-mini NASDAQ-100 Index (NQ) Futures Technical Analysis – Strength Over 16376.00, Weakness Under 16338.25
December E-mini NASDAQ-100 Index futures closed higher on Thursday after posting another record high on the back of a surge in chipmaker stocks, led by Qualcomm’s strong financial forecast. Investors were also influenced by the Federal Reserve’s decision to start reducing its monthly bond purchases and its decision to refrain from lifting interest rates as widely expected.
On Thursday, December E-mini NASDAQ-100 Index futures settled at 16338.25, up 208.50 or +1.28%.
Qualcomm shares jumped as the company forecast better-than-expected profits and revenue for its current quarter on soaring demand for chips used in phones, cars and other internet-connected devices.
Daily Swing Chart Technical Analysis
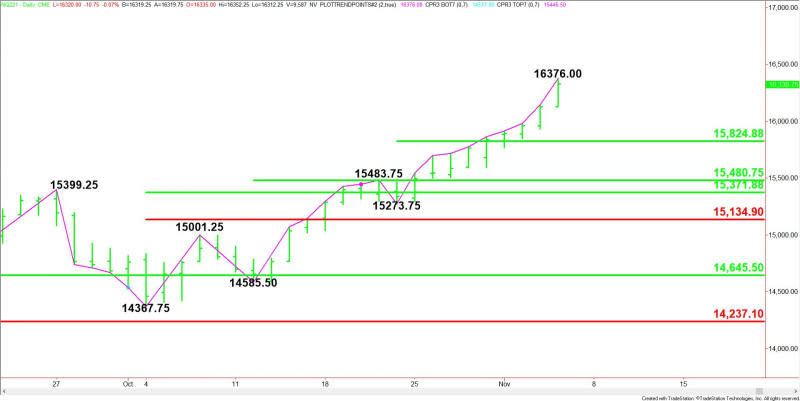
The main trend is up according to the daily swing chart. A trade through 16376.00 early Friday will signal a resumption of the uptrend. A move through 15273.75 will change the main trend to down. As of Friday, the index will be up for the 10th session following the last main bottom. This puts it inside the window of time for a closing price reversal top.
The minor range is 15273.75 to 16376.00. Its 50% level at 15824.75 is the nearest support. Additional support comes in at 15480.75.
The short-term range is 14367.75 to 16376.00. Its retracement zone at 15371.75 to 15135.00 is a value zone.
Daily Swing Chart Technical Forecast
The direction of the December E-mini NASDAQ-100 Index early Friday is likely to be determined by trader reaction to 16376.00 and 16338.25.
Bullish Scenario
A sustained move over 16376.00 will indicate the presence of buyers. This could trigger an acceleration to the upside.
Bearish Scenario
A sustained move under 16338.25 will signal the presence of sellers. Taking out 16129.50 will indicate the selling pressure is getting stronger. This could trigger further breaks into 15935.25 and 15849.50 become the first key support level at 15824.75.
Side Notes
Taking out 16376 then closing lower for the session will form a potentially bearish closing price reversal top. If confirmed, this could trigger the start of a 2 to 3 day correction.
For a look at all of today’s economic events, check out our economic calendar.
This article was originally posted on FX Empire
