Dollar Technical Analysis: DXY Momentum May Limit December Downside
DailyFX.com -
Talking Points:
Dollar Technical Strategy: Can the EUR Stop the Stronghold USD, Not Counting On It
Central Banks Line Up For All-Important Rate Announcements in Mid-December
The Dollar’s meteoric rise brought out a lot of doubters of the whether or not the move was sustainable. In the weeks following the election, which ushered in worries of a Fed that are “behind the curve” caused traders to bid up USD. However, the main question as we sit a few handles away from 14-year highs is whether or not such a move is sustainable.
Access Our Free Q4 Dollar Outlook As The Fed Decides How To Handle a Trump Presidency
To a handful of asset managers, the question is less whether the USD can sustain the rally and more focused on what took the USD so long to launch. Much of their focus has been on the increase in USD-Denominated debt in emerging economies that ballooned after the Great Financial Crisis that will need to be repaid. Repaying international debt naturally requires selling a home currency and buying the USD in this case. Such an environment is where the reserve currency may resume the upward tilt.
The pause since November 24 appears to be just that, a pause in the strong trend as opposed to the start of an abrupt reversal. The high of 102.05 of course will be watched for a retest as the ECB meets on December 8 followed by the Fed on December 14. Since then, we had the aggressive ~300 pip Bullish daily range in EUR/USD on the back of the Italian ‘No’ vote in the Constitutional Referendum. The sharp reversal caused many to recall the reversal on a disappointing ECB announcement a year ago that saw EUR/USD eventually work toward a ~1,000 reversal higher.
As we sit in preparation for two highly anticipated central bank announcements where we question whether or not the Fed will take on a new level hawkishness given the fundamentally new financial environment we find ourselves in as well as the ECB’s Taper plan, there is a lot of room to maneuver in FX. However, the path of least resistance continues to look higher if the price remains above a handful of our favorite indicators on the chart.
D1 Chart Shows Strong Bullish Form In Rising Channel
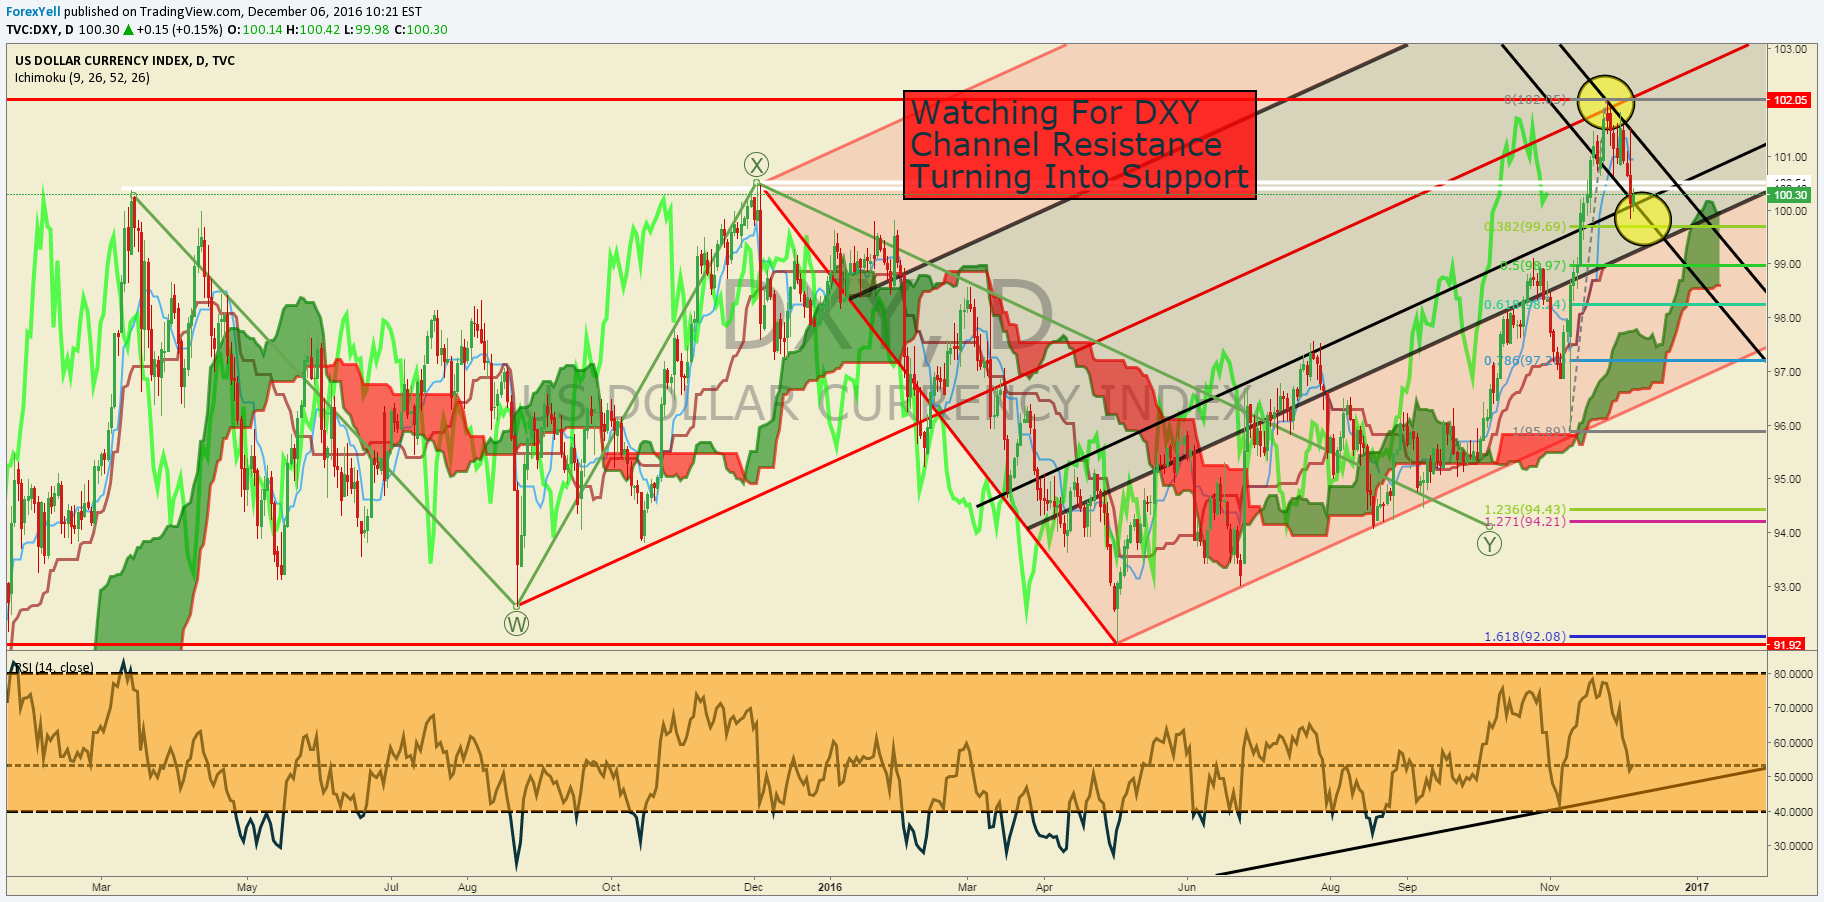
The chart above is utilizing three key indicators to analyze price action: The Andrew’s Pitchfork, Ichimoku Cloud, & RSI(14). Each indicator has their helpful points, but let’s walk through what they’re showing in order.
The Andrew’s Pitchfork has framed price action very well and is showing strong advancement in a rising channel. The median line, which is drawn off the August 24, 2015, low and subsequent extremes has had a bullish slope and has acted as Bullish trend support and resistance.
While utilizing Andrew’s Pitchfork, the pullback or pause from 102.05 that aligned with the median line of the Pitchfork is to be expected. The encouraging sign for USD Bulls is the evidence of potential support on the trendline drawn off price trendline resistance. Should the current level ~100 hold as support, we could be in the making of a polarity point, which would enhance bullish prospects.
Ichimoku Cloud shows two largely Bullish signals in that the price is above the Cloud and the Momentum Line (bright green lagging line) is above past price. While these are elementary views of utilizing Ichimoku, they keep the focus higher. Another indicator of Ichimoku is the Base Line or 26-period mid-point that shows price may find support at or above 98.97, which also aligns with the 50% retracement of the November price range. Price above these levels (98.97 and the Cloud) should help keep a trader anticipating further upside.
Lastly, RSI(14) helps communicate a Bullish cycle, with the RSI(14) line ranging within 80-40, and holding above a rising trendline. RSI(14) can be seen as a momentum trigger on many trading strategies, but the walk-away point would be that with price above the RSI(14) trendline / 40 level, we should also give the benefit of the doubt to the Bullish argument.
Lastly, it’s important to keep an eye on upcoming opening ranges in both December and H1 2017. If the price can break above the Opening Range High for December (101.59), we would also take that as a strong sign that the trend is resuming higher as the technical indicators we’ve analyzed above have favored.
Should a longer-term top be developing, we would look for a break below the Base Line on Ichimoku at 98.97 following by a breakdown of the Bullish RSI(14) stance and further resumption of EUR strength against USD.
Shorter-Term DXY Technical Levels for Tuesday, December 6, 2016
For those interested in shorter-term levels of focus than the ones above, these levels signal important potential pivot levels over the next 48-hours of trading.

T.Y.
DailyFX provides forex news and technical analysis on the trends that influence the global currency markets.
Learn forex trading with a free practice account and trading charts from IG.
