What Did This College Football Season Cost Universities?
No sport or league was spared from the chaos of 2020, but the size, scope, number of teams and sprawling nature of college football made playing during the time of COVID-19 a mess. The Big Ten, Southeastern Conference and Pac-12 opted for conference-only play in July and by August, confusion and uncertainty reigned. The MAC and Mountain West postponed their seasons, followed closely by the Big Ten and Pac-12.
After weeks of back-and-forth, the vast majority of the big conferences and teams had agreed to play at least some games, and the season progressed clumsily toward a very uncertain postseason.
The question of attendance has been an inconsistent hodge-podge from the beginning. Some teams are playing in front of fans to a certain percentage of normal capacity. Others are playing to empty stands where local regulations prohibit live attendance. Others are playing all their games in shuttered facilities whether the state allows fans or not. One thing, however, is certain — a lot of schools are going to lose a lot of money.
In order to get an idea of what each college football team stands to lose from the chaotic 2020 season, GOBankingRates used the U.S. Department of Education’s Equity in Athletics Data Analysis from 2017, 2018 and 2019 to learn about each team’s average revenue and profits. Those numbers were used as markers for potential revenue and profits that could be lost this year.
This list includes the 30 colleges that bring in the highest average football revenues and profits — ranked from lowest to highest average profit — so you can get a look at what this season could cost them. See how much these schools stand to lose.
Last updated: Nov. 12, 2020

30. North Carolina State University at Raleigh
Three-Year Average Total Football Revenue: $44,693,802
Three-Year Average Profit from Football: $22,853,140

29. University of Mississippi
Three-Year Average Total Football Revenue: $54,047,030
Three-Year Average Profit from Football: $23,113,424

28. Oklahoma State University
Three-Year Average Total Football Revenue: $46,720,291
Three-Year Average Profit from Football: $24,694,082

27. University of Southern California
Three-Year Average Total Football Revenue: $56,685,261
Three-Year Average Profit from Football: $24,932,248

26. University of Illinois at Urbana-Champaign
Three-Year Average Total Football Revenue: $48,357,957
Three-Year Average Profit from Football: $25,701,801

25. Texas Tech University
Three-Year Average Total Football Revenue: $46,925,210
Three-Year Average Profit from Football: $26,171,074

24. Virginia Tech
Three-Year Average Total Football Revenue: $55,014,799
Three-Year Average Profit from Football: $27,353,753

23. University of Minnesota-Twin Cities
Three-Year Average Total Football Revenue: $57,821,805
Three-Year Average Profit from Football: $27,452,206
Find Out: Ohio State Ranks in Top 5 Richest College Football Programs — But Who Is No. 1?

22. University of South Carolina-Columbia
Three-Year Average Total Football Revenue: $63,228,276
Three-Year Average Profit from Football: $28,455,181

21. University of Arkansas
Three-Year Average Total Football Revenue: $71,837,589
Three-Year Average Profit from Football: $30,130,033

20. University of Utah
Three-Year Average Total Football Revenue: $56,858,821
Three-Year Average Profit from Football: $30,406,913

19. Texas A&M University
Three-Year Average Total Football Revenue: $75,502,967
Three-Year Average Profit from Football: $34,836,172

18. University of Iowa
Three-Year Average Total Football Revenue: $71,895,512
Three-Year Average Profit from Football: $37,985,035

17. The University of Alabama
Three-Year Average Total Football Revenue: $104,608,030
Three-Year Average Profit from Football: $39,636,390

16. University of Oregon
Three-Year Average Total Football Revenue: $69,665,227
Three-Year Average Profit from Football: $39,780,723

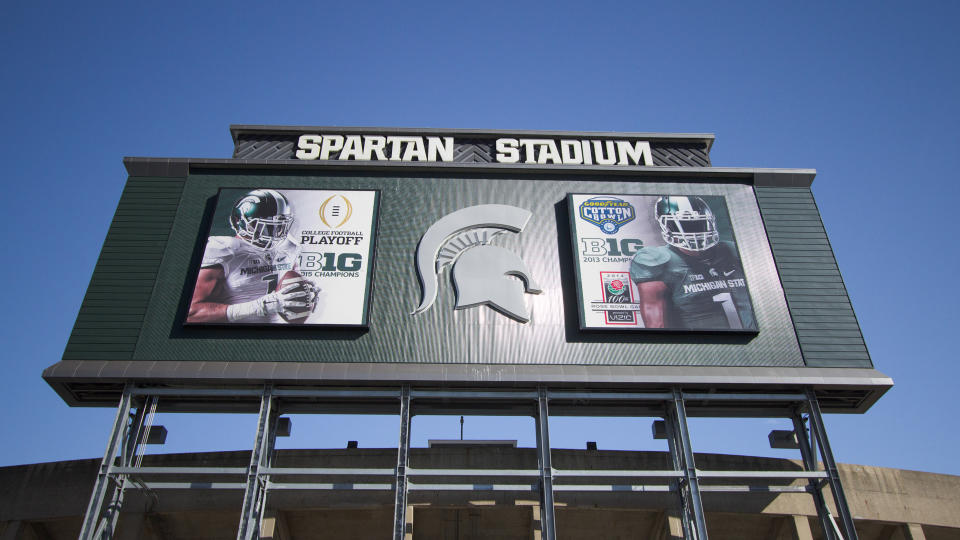
15. Michigan State University
Three-Year Average Total Football Revenue: $72,811,869
Three-Year Average Profit from Football: $41,550,930

14. University of Washington
Three-Year Average Total Football Revenue: $81,801,180
Three-Year Average Profit from Football: $42,841,217

13. University of Florida
Three-Year Average Total Football Revenue: $85,205,128
Three-Year Average Profit from Football: $45,143,730

12. University of Nebraska-Lincoln
Three-Year Average Total Football Revenue: $85,448,712
Three-Year Average Profit from Football: $46,360,843

11. Auburn University
Three-Year Average Total Football Revenue: $93,457,619
Three-Year Average Profit from Football: $48,698,685

10. Pennsylvania State University
Three-Year Average Total Football Revenue: $93,779,668
Three-Year Average Profit from Football: $49,355,479
Read More: The Highest-Paid College Football Coaches of the Last 10 Years

9. University of Wisconsin-Madison
Three-Year Average Total Football Revenue: $81,972,237
Three-Year Average Profit from Football: $50,300,692

8. Louisiana State University
Three-Year Average Total Football Revenue: $88,237,934
Three-Year Average Profit from Football: $55,915,360

7. Ohio State University
Three-Year Average Total Football Revenue: $105,215,165
Three-Year Average Profit from Football: $56,892,716
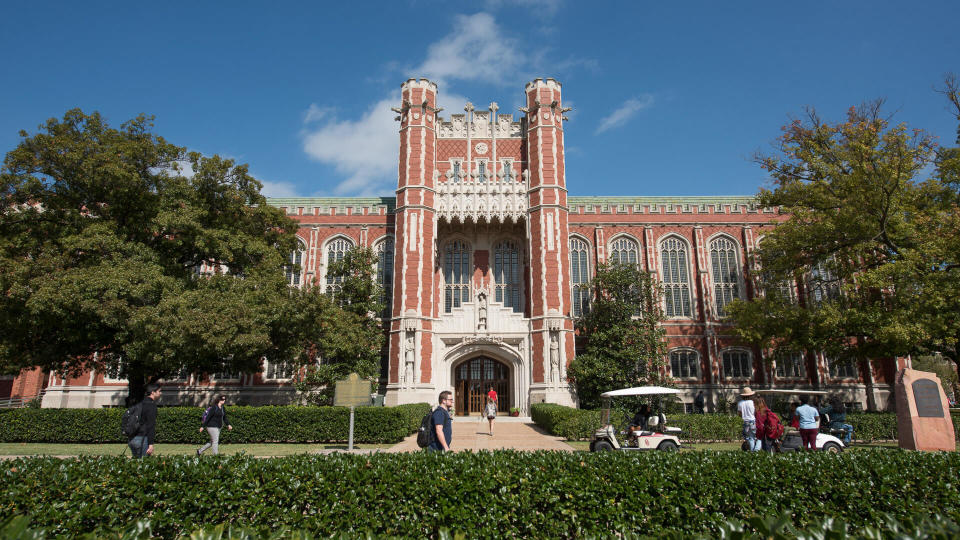
6. University of Oklahoma
Three-Year Average Total Football Revenue: $97,671,887
Three-Year Average Profit from Football: $57,542,015

5. The University of Tennessee-Knoxville
Three-Year Average Total Football Revenue: $98,528,735
Three-Year Average Profit from Football: $60,823,889

4. University of Notre Dame
Three-Year Average Total Football Revenue: $106,593,322
Three-Year Average Profit from Football: $64,499,430

3. University of Georgia
Three-Year Average Total Football Revenue: $115,144,200
Three-Year Average Profit from Football: $71,642,424

2. University of Michigan-Ann Arbor
Three-Year Average Total Football Revenue: $117,691,615
Three-Year Average Profit from Football: $71,980,419

1. The University of Texas at Austin
Three-Year Average Total Football Revenue: $146,794,944
Three-Year Average Profit from Football: $104,209,024
More From GOBankingRates
Over Half of Americans Are Missing Out on Free Money — Are You One of Them?
Are You Spending More Than the Average American on 25 Everyday Items?
Guns and 32 Other Things You Definitely Do NOT Need To Buy During the Coronavirus Pandemic
Methodology: GOBankingRates looked at the US Department of Education’s Equity in Athletics Data Analysis from 2019, 2018, and 2017 to discover what this season of college football during the Coronavirus pandemic may cost each institution. GOBankingRates first found (1) 2019 total football revenue; (2) 2019 total football expenses; (3) 2019 profit from football program; (4) 2018 total football revenue; (5) 2018 total football expenses; (6) 2018 profit from football program; (7) 2017 total football revenue; (8) 2017 total football expenses; and (9) 2017 profit from football program for every institution. Then, to calculate potential losses for this current season, GOBankingRates found (10) three-year average total football revenues; (11) three-year average total football expenses; and (12) three-year average profit from football program for every institution. In order to be considered, each institution had to have a NCAA Division 1 FBS football program in the 2020 season. All data was collected on and up to date as of Nov. 9, 2020.
This article originally appeared on GOBankingRates.com: What Did This College Football Season Cost Universities?
