Declining Stock and Solid Fundamentals: Is The Market Wrong About Travis Perkins plc (LON:TPK)?
Travis Perkins (LON:TPK) has had a rough three months with its share price down 22%. However, stock prices are usually driven by a company’s financial performance over the long term, which in this case looks quite promising. Particularly, we will be paying attention to Travis Perkins' ROE today.
Return on equity or ROE is an important factor to be considered by a shareholder because it tells them how effectively their capital is being reinvested. Simply put, it is used to assess the profitability of a company in relation to its equity capital.
View our latest analysis for Travis Perkins
How Do You Calculate Return On Equity?
The formula for return on equity is:
Return on Equity = Net Profit (from continuing operations) ÷ Shareholders' Equity
So, based on the above formula, the ROE for Travis Perkins is:
11% = UK£241m ÷ UK£2.2b (Based on the trailing twelve months to December 2021).
The 'return' is the profit over the last twelve months. One way to conceptualize this is that for each £1 of shareholders' capital it has, the company made £0.11 in profit.
Why Is ROE Important For Earnings Growth?
So far, we've learned that ROE is a measure of a company's profitability. Based on how much of its profits the company chooses to reinvest or "retain", we are then able to evaluate a company's future ability to generate profits. Assuming everything else remains unchanged, the higher the ROE and profit retention, the higher the growth rate of a company compared to companies that don't necessarily bear these characteristics.
A Side By Side comparison of Travis Perkins' Earnings Growth And 11% ROE
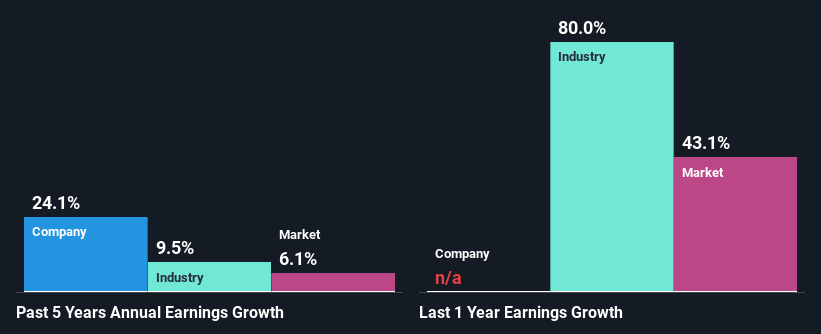
To begin with, Travis Perkins seems to have a respectable ROE. Yet, the fact that the company's ROE is lower than the industry average of 15% does temper our expectations. However, we are pleased to see the impressive 24% net income growth reported by Travis Perkins over the past five years. We reckon that there could be other factors at play here. For instance, the company has a low payout ratio or is being managed efficiently. Bear in mind, the company does have a respectable ROE. It is just that the industry ROE is higher. So this certainly also provides some context to the high earnings growth seen by the company.
Next, on comparing with the industry net income growth, we found that Travis Perkins' growth is quite high when compared to the industry average growth of 9.5% in the same period, which is great to see.
The basis for attaching value to a company is, to a great extent, tied to its earnings growth. It’s important for an investor to know whether the market has priced in the company's expected earnings growth (or decline). By doing so, they will have an idea if the stock is headed into clear blue waters or if swampy waters await. Has the market priced in the future outlook for TPK? You can find out in our latest intrinsic value infographic research report.
Is Travis Perkins Using Its Retained Earnings Effectively?
Travis Perkins' ' three-year median payout ratio is on the lower side at 23% implying that it is retaining a higher percentage (77%) of its profits. So it seems like the management is reinvesting profits heavily to grow its business and this reflects in its earnings growth number.
Besides, Travis Perkins has been paying dividends for at least ten years or more. This shows that the company is committed to sharing profits with its shareholders. Our latest analyst data shows that the future payout ratio of the company is expected to rise to 40% over the next three years. Regardless, the ROE is not expected to change much for the company despite the higher expected payout ratio.
Conclusion
On the whole, we feel that Travis Perkins' performance has been quite good. Specifically, we like that it has been reinvesting a high portion of its profits at a moderate rate of return, resulting in earnings expansion. That being so, a study of the latest analyst forecasts show that the company is expected to see a slowdown in its future earnings growth. To know more about the latest analysts predictions for the company, check out this visualization of analyst forecasts for the company.
Have feedback on this article? Concerned about the content? Get in touch with us directly. Alternatively, email editorial-team (at) simplywallst.com.
This article by Simply Wall St is general in nature. We provide commentary based on historical data and analyst forecasts only using an unbiased methodology and our articles are not intended to be financial advice. It does not constitute a recommendation to buy or sell any stock, and does not take account of your objectives, or your financial situation. We aim to bring you long-term focused analysis driven by fundamental data. Note that our analysis may not factor in the latest price-sensitive company announcements or qualitative material. Simply Wall St has no position in any stocks mentioned.
