These Charts Tell You That the USD is Back
Monday, September 1, US Dollar index was losing against major pairs, until US Manufacturing PMI and ISM Manufacturing data were released and the announced data were positive beyond the forecasted.
FOMC Member Mrs. Brainard in her speech yesterday outlined key changes in the economy. FED rate cut expected by some investors in September is most-likely out of the question, as inflation targets are currently beyond expectations. For that being said the FED will apply FAIT strategy to anchor 2 percent inflation expectations.
US Dollar Index is down by 10.91% since the year’s high of 102.99 experienced this March. The decline was followed by rate cuts and drastically growing number of Covid-19 cases in the US, however there are several charts that show that the DXY is about to recover from a decline.
DXY Monthly Chart
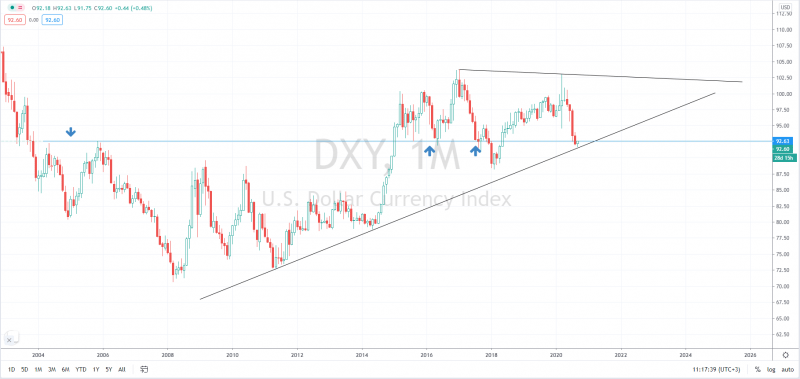
Dollar index reached the dynamic support, thogh is still below the important support and resistance zone. If the Index remains below 92.63 and breaks the dynamic support it may continue the decline to 89.97 – 90.
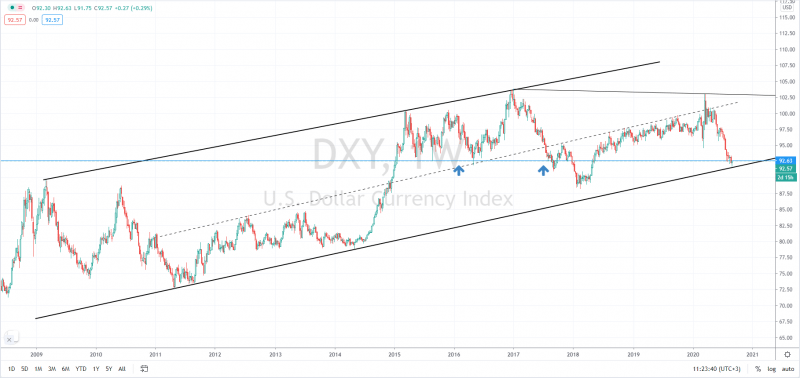
A closer look at the formation on a weekly chart.
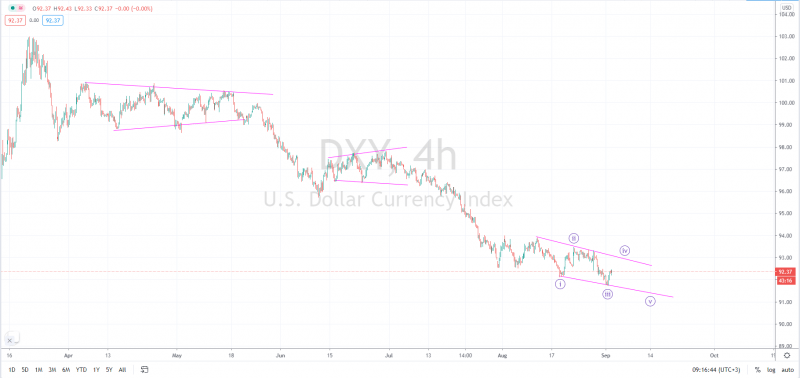
Descending diagonal on a 4H chart signals the further decline towards 91.60 – 91 after testing of the upper edge of the diagonal at 92.90 – 93.
FOMC in the new strategy changes outlined unemployment data as one of the key patterns in stabilizing the economy and reaching goals. Hence, unemployment in the US recovered in August, and the expected release of today’s ADP Non-farm unemployment could play a significant role in the further trend definition of the US Dollar Index.
US Dollar against major pairs
The German manufacturing PMI as per August released yesterday was 52.2 which below the expected 53, although gained 2.2 points from the previous month’s 51.0. There was a significant recovery in Unemployment in August in Germany, announcing -9K, which is 8K above the July’s -17K, whereas a preliminary release of CPI (YoY) was at -0.2%, both released yesterday, September 1. Today’s release of data from Germany and Spain triggered a decline on EURUSD.
EURUSD may continue the decline towards 1.1800 – 1.1790 to test the dynamic support and the MA200.

The British pound against the US Dollar may also decline further amid strong US data.
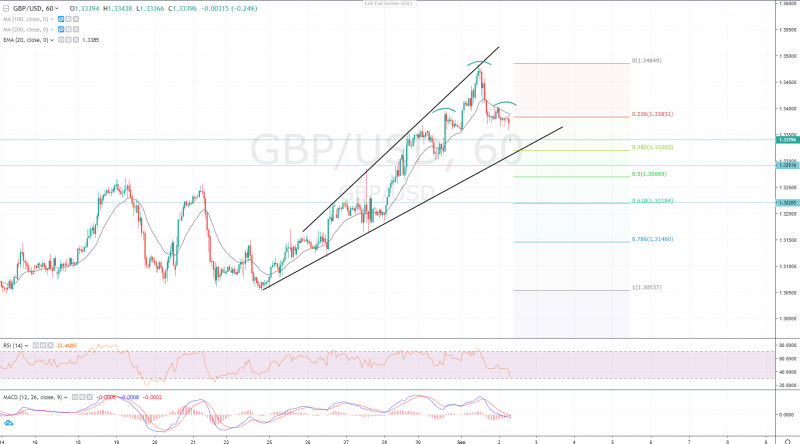
The Head and Shoulders pattern on an hourly chart signals the continuation of a decline towards 1.33120, whereas Pound might find a support at 1.33200 at the dynamic support of August 20. If the Pound breaks the dynamic support, bears might push the price further 1.32900, and below that towards 1.32700 at Fibonacci 0.5.
Safe-haven commodity remains bullish above 1955.
Gold, a safe-haven asset may continue bullish runs if remains above a significant support at $1955. However strong US data may decline the price further. There once again a high risk of another Head and Shoulders formation and the precious metal may drop to $1930 – $1925.
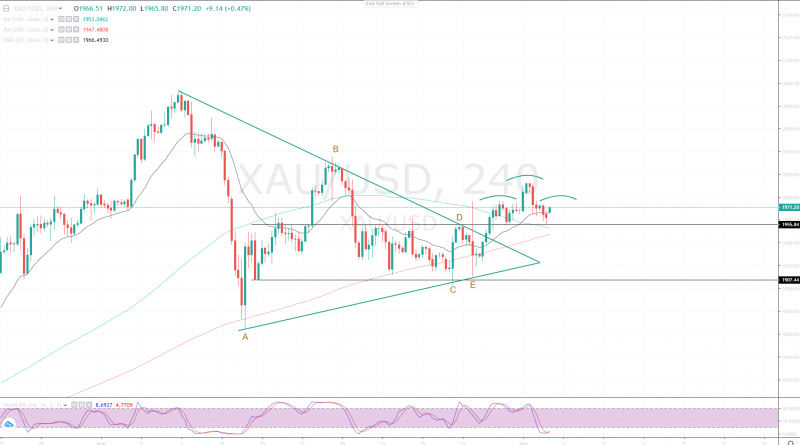
According to the Elliott Wave principle, long-term Gold sentiment remains bullish and the price of the precious metal may reach year’s high in mid-term, US-China trade war and escalation of the conflict may further support the uptrend of the safe-haven, despite the US economics’ recovery.
This article was originally posted on FX Empire
More From FXEMPIRE:
Grinding, Grinding, Stocks Keeps Rising – Wait, ADP is Here!
Crude Oil Prices Likely to Remain Positive in the Long Term on Supply/Demand Dynamics
U.S. Stocks Set To Open Higher As Traders Bet On New Stimulus Package
Daily Gold News: September 2 – Precious Metals Lower Following Strengthening U.S. Dollar
