Bitcoin Eyes $7,800 After Biggest Daily Price Gain in a Month
View
Bitcoin jumped above $7,400 on Wednesday, confirming a bullish breakout on the short duration technical charts.
Resistance at $7,800 could come into play in the next 48 hours. A violation there would expose $8,200.
The nascent recovery will fall apart if Wednesday’s low of $6.848 is breached. At press time, that looks unlikely.
Bitcoin eked out the biggest single-day gain in four weeks on Wednesday, confirming a short-term price breakout and opening doors for a test of resistance at $7,800.
The number one cryptocurrency printed a UTC close at $7,528 on Bitstamp, representing a 5.15 percent gain on the daily opening price of $7,168. That’s the biggest single-day price rise since Oct. 26. On that day, BTC rose by 6.81 percent and printed highs above $10,300.
Wednesday’s gain looks more impressive if we take into account the rejection of lower prices seen during the European trading hours. Prices had dropped to $6,850, but were quickly reversed and the cryptocurrency ended the day on an optimistic note, validating the seller exhaustion signaled by key technical indicators.
Related: What the Crypto Markets Are Saying About the Future of Bitcoin
More importantly, BTC activated twin bullish cues on the intraday charts with a convincing move above $7,400 and could continue to draw bids in the short-term.
At press time, BTC is changing hands at $7,480, having hit a high of $7,670 during the U.S. trading hours on Wednesday.
4-hour chart
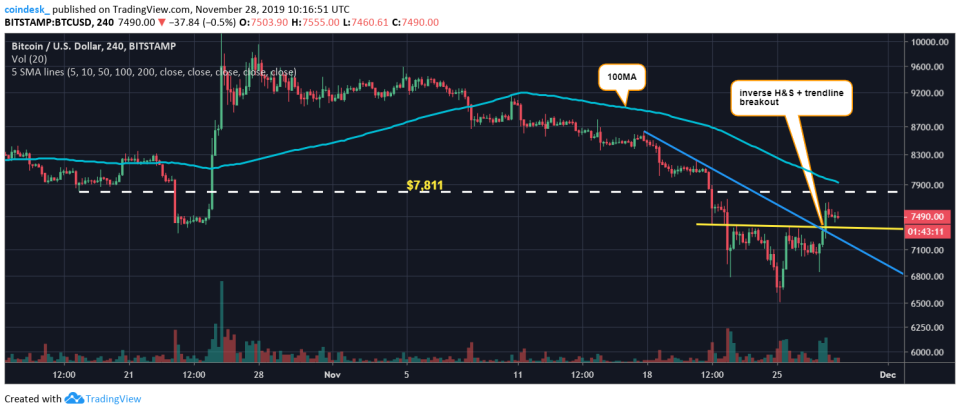
Both an upside break of the descending trendline and inverse head-and-shoulders breakout indicate the path of least resistance is to the higher side.
Related: Lebanese Bitcoiners Show How to Talk About Crypto At Thanksgiving
The latter represents a transition from the lower-highs, lower-lows set up to one of higher lows and higher highs. It’s considered a potent bullish reversal pattern if it appears following a significant price drop, which is the case here.
The bullish reversal pattern has created room for a rally to $8,200 (target as per the measured move method).
On the way higher, the pair may face resistance at $7,800 (horizontal line) and the descending 100-candle average, currently at $7,936.
Hourly chart
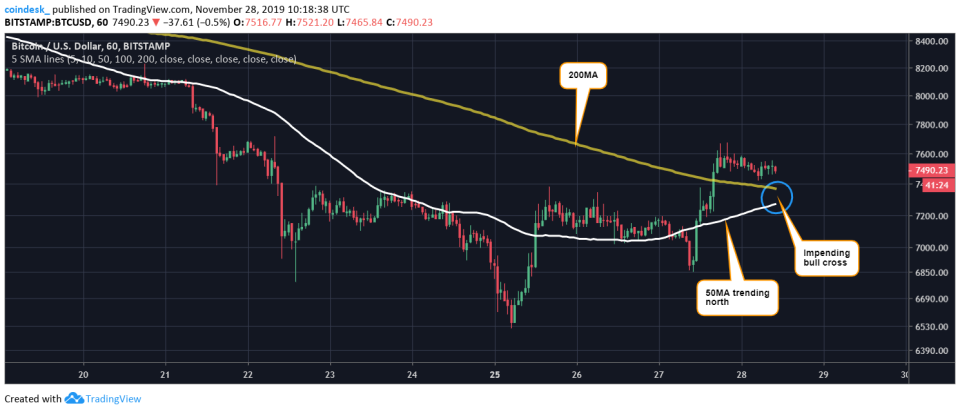
The 50-hour average is beginning to trend north – a sign of strengthening upside momentum – and looks set to cross above the 200-hour average in coming days. The impending bull cross may invite stronger buying pressure, possibly yielding a rally to $7,800.
That said, a short-term bullish reversal would only be confirmed if the current three-day candle closes (Friday, UTC) above $7,380.
On the downside, Wednesday’s low of $6,848 is key support, which if breached with strong volumes, would kill the nascent recovery and shift risk in favor of a re-test of $6,500.
Disclosure: The author holds no cryptocurrency assets at the time of writing.
