Kimble Charting
Energy Stocks Exploring Multi-year pennant breakout
Energy Stocks Exploring Multi-year pennant?breakout

CLICK ON CHART TO ENLARGE
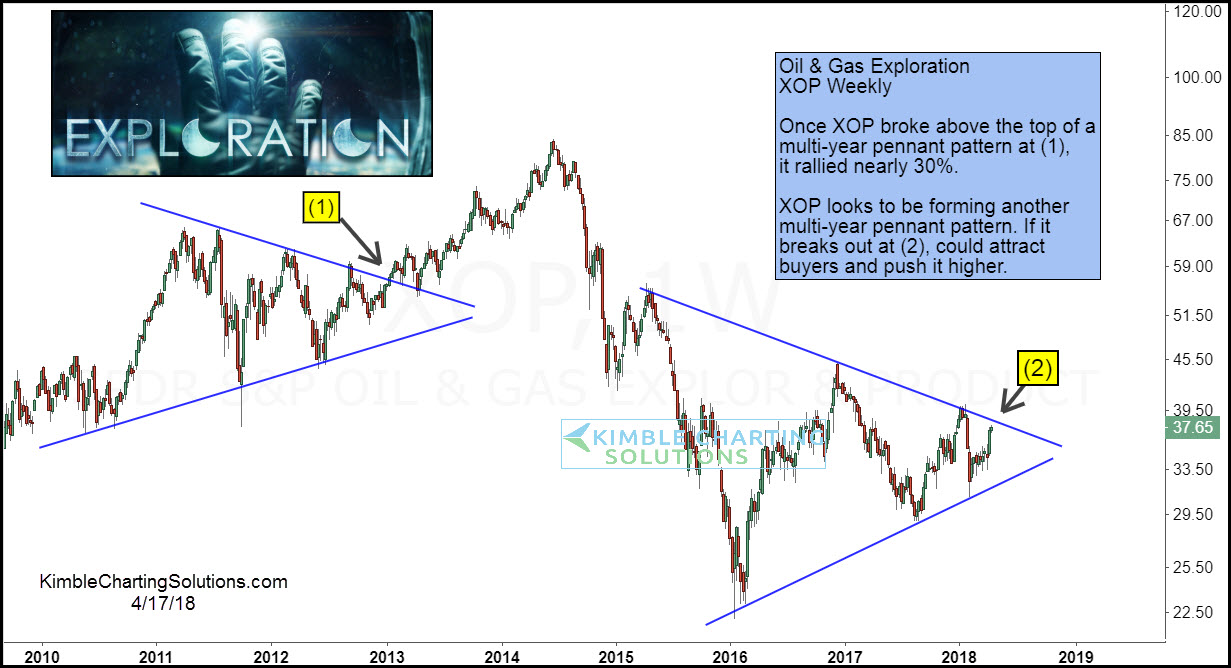
The chart above looks at Oil & Gas Exploration EFT (XOP) over the past 8-years.
From 2010 until 2013 it looks to have created a pennant pattern (series of higher lows and lower highs). Once resistance was taken out at (1), buyers came forward and XOP rallied nearly 30% in the next couple of years.
Over the last few years, XOP looks to be creating another pennant?