XRP Price Prediction: XRP in the Hands of the FED and US Stats
Key Insights:
XRP slipped by 0.98% on Tuesday. A choppy session saw XRP at sub-$0.32 levels before briefly testing resistance at $0.33.
Investor angst over the economic outlook delivered a choppy session. Economic indicators from Europe and the US gave mixed signals.
Technical indicators are bearish, with XRP sitting below the 50-day EMA.
On Tuesday, XRP slipped by 0.98%. Partially reversing a 2.21 gain from Monday, XRP ended the day at $0.3249.
A bearish morning saw XRP slide through the First Major Support Level at $0.3185 to a low of $0.3127.
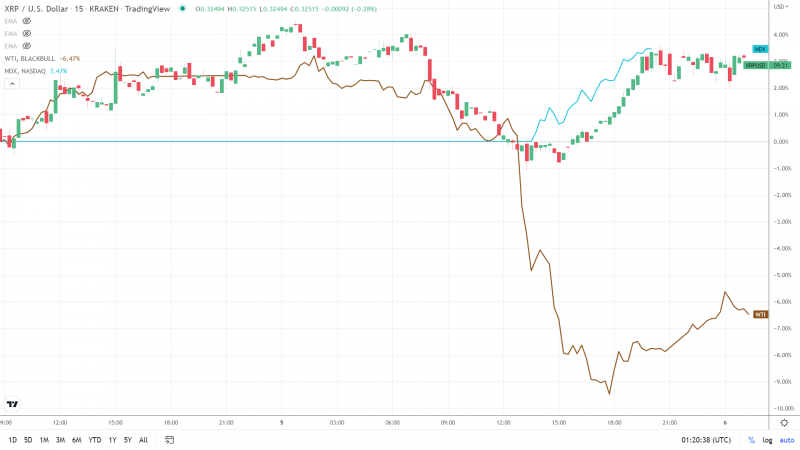
Finding NASDAQ 100 support, XRP rallied to a high of $0.3304 before a late pullback to sub-$0.3280.
Weak economic data from the Eurozone fueled fears of a global economic recession, leading to a slide in XRP and crude oil prices.
However, US economic indicators delivered the NASDAQ 100 with support through the US session. The pickup in risk appetite provided XRP support before a post-US close pullback into the red.
While XRP remained in the hands of broader market risk sentiment on Tuesday, the ongoing SEC v Ripple case remains the key driver.
News Wires Remained Silent on Pending Hinman Court Ruling
There were no updates or rulings from the SEC v Ripple case to provide price direction.
As the case drags on, investors await a court ruling on whether Hinman’s 2018 speech-related documents fall under the attorney-client privilege. A ruling in favor of the defendants could force the SEC to agree to settle, which would support a price breakout.
In 2018, the former SEC Director of the Division of Corporation Finance said that Bitcoin (BTC) and Ethereum (ETH) are not securities.
Hinman remains the focal point of the case. The SEC has filed more than six motions to shield Hinman’s speech-related documents.
Price Action
At the time of writing, XRP was down 0.09% to $0.3246.
A mixed start to the day saw XRP fall to a low of $0.3224 before rising to a high of $0.3266.
Technical Indicators
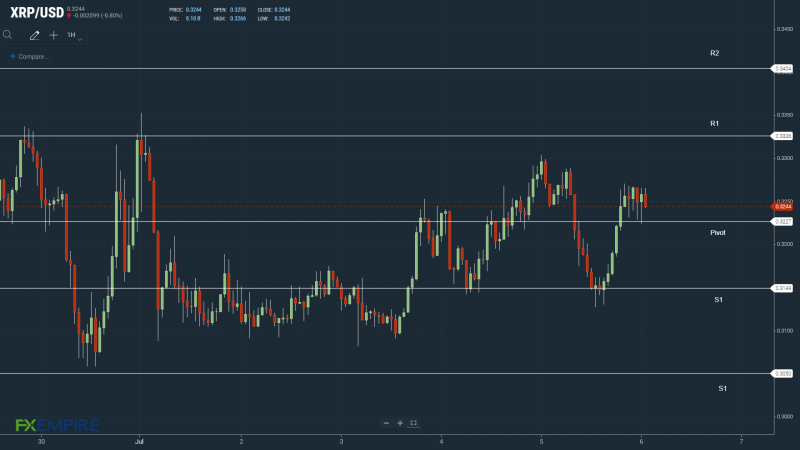
Avoiding the $0.3227 pivot would bring the First Major Resistance Level at $0.3326 into play.
XRP would need the support of the broader market to breakout from the Tuesday high of $0.3304.
In the case of an extended crypto rally, XRP could test the Second Major Resistance Level at $0.3404. The Third Major Resistance Level sits at $0.3581.
A fall through the pivot would bring the First Major Support Level at $0.3149 into play.
Barring an extended sell-off, XRP should avoid sub-$0.31 and the Second Major Support Level at $0.3050. The Third Major Support Level sits at $0.2873.
However, a court ruling on the Hinman speech-related documents would remove the influence of the Support and Resistance Levels.
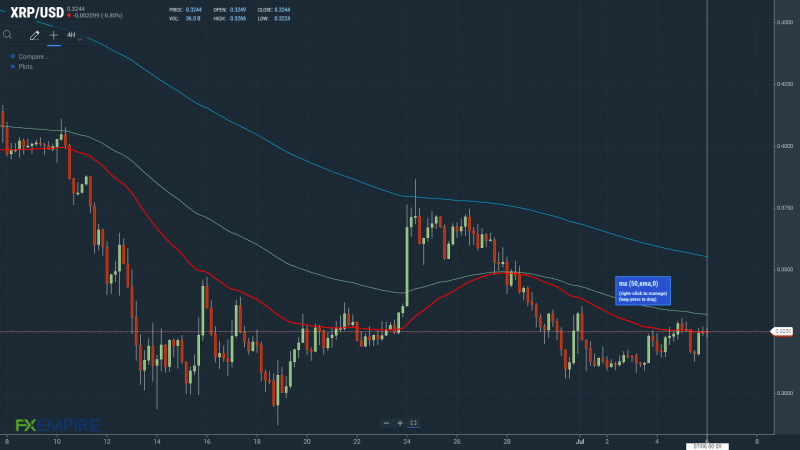
The EMAs and the 4-hourly candlestick chart (below) send a bearish signal.
At the time of writing, XRP sat at the 50-day EMA, currently at $0.3250. Today, the 50-day EMA flattened on the 100-day EMA. The 100-day EMA eased back from the 200-day EMA, XRP price negative.
A breakout from the 50-day EMA would bring the 100-day EMA, currently at $0.3323, and R1 into play.
However, another XRP pullback from the 50-day EMA would bring the Major Support Levels into play.
This article was originally posted on FX Empire
