How to use visual metering tools to help you mix
DAWs are full of great features to help view and analyse our tracks and this month we’re going to look at how to use some of these during the mix process.
Working in audio, and mixing in particular is mostly about using your ears and training yourself to hear things in a number of different ways. This combination of critical listening and more general objectivity can take some time to master.
Nevertheless, there are times when we can and should be using our eyes as well. The most obvious example is level meters. But beyond making sure we don’t overload the channel, what information do these convey? And what about spectrum analysers, correlation meters and everyone’s current favourite, the loudness or LUFS meter?
In this masterclass I’m going to focus on the metering and visual tools you can use when mixing, looking at the specific options available, what information they provide and how we can use them to assist our ears. Most DAWs already include a decent set of analysis tools, but if you have the budget there are some awesome third-party options. If you don't want to shell out, you can use the excellent (and free) Voxengo SPAN.
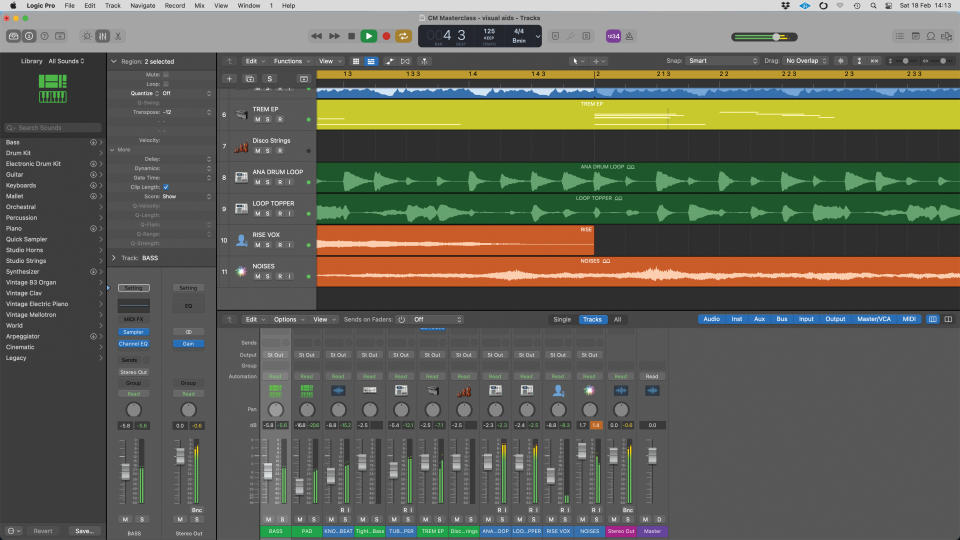
Let’s start with levels. The main meters you should be looking at are the peak-style meters next to your faders. I’m not going to get into the topic of gain-staging here as this will be covered in a future masterclass. Still, although avoiding overloads is not always necessary in a 32-bit floating system, it is a wise move.
The options for fader-side metering vary across DAWs, but usually include basic peak level metering, so you should have that covered. If you want more detailed level metering such as RMS, VU or LUFS (which I look at in steps 5 and 6), you may have to load a separate plugin or even purchase a third party plugin.
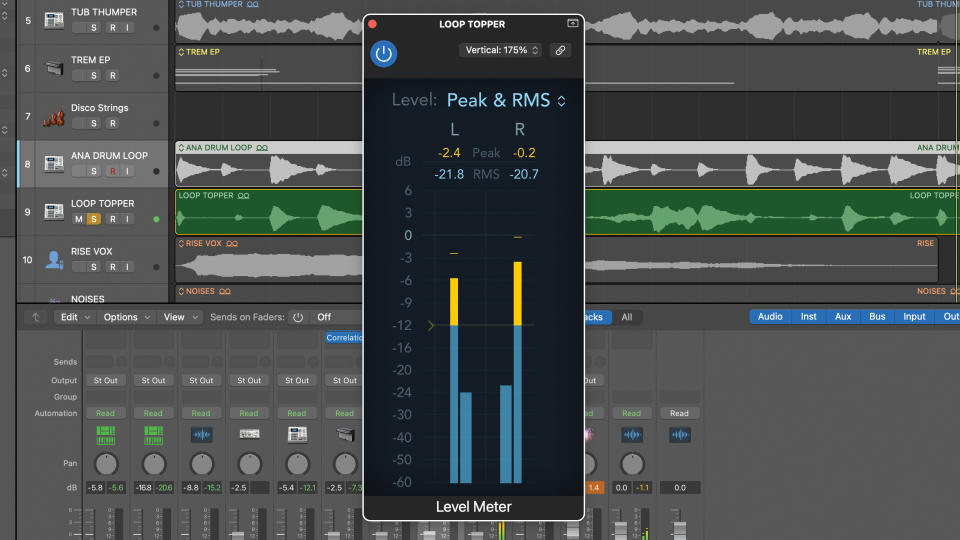
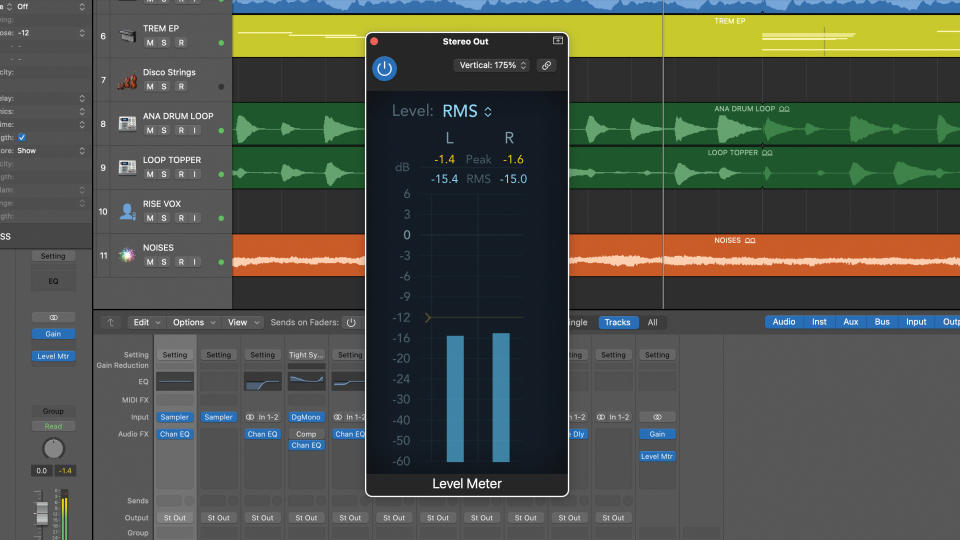
The reason you might want various level indicators is because they show loudness in different ways and achieving perceived loudness is a key aspect of mixing. For example, it’s easy to have high peaks but for the mix to sound quiet. RMS (root mean squared) meters can help you judge this as they better indicate perceived loudness.
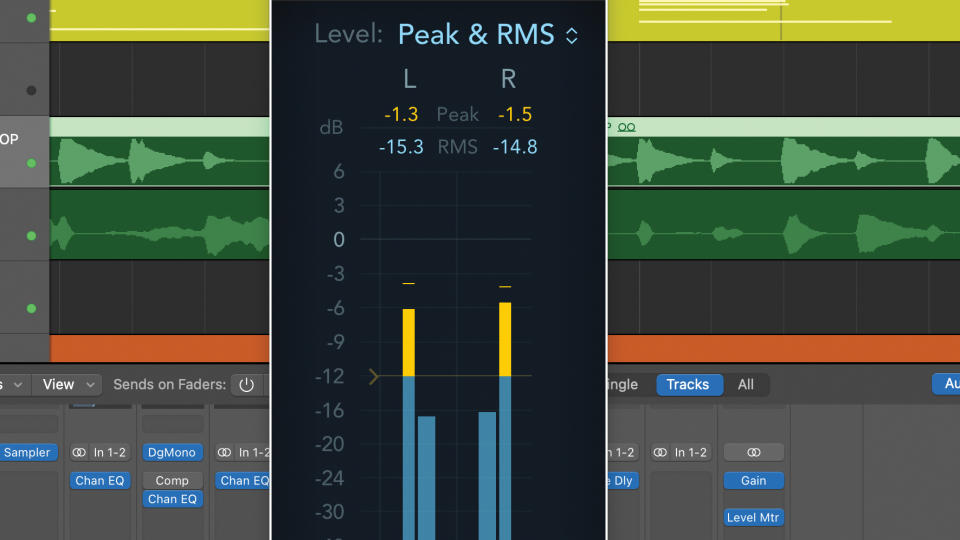
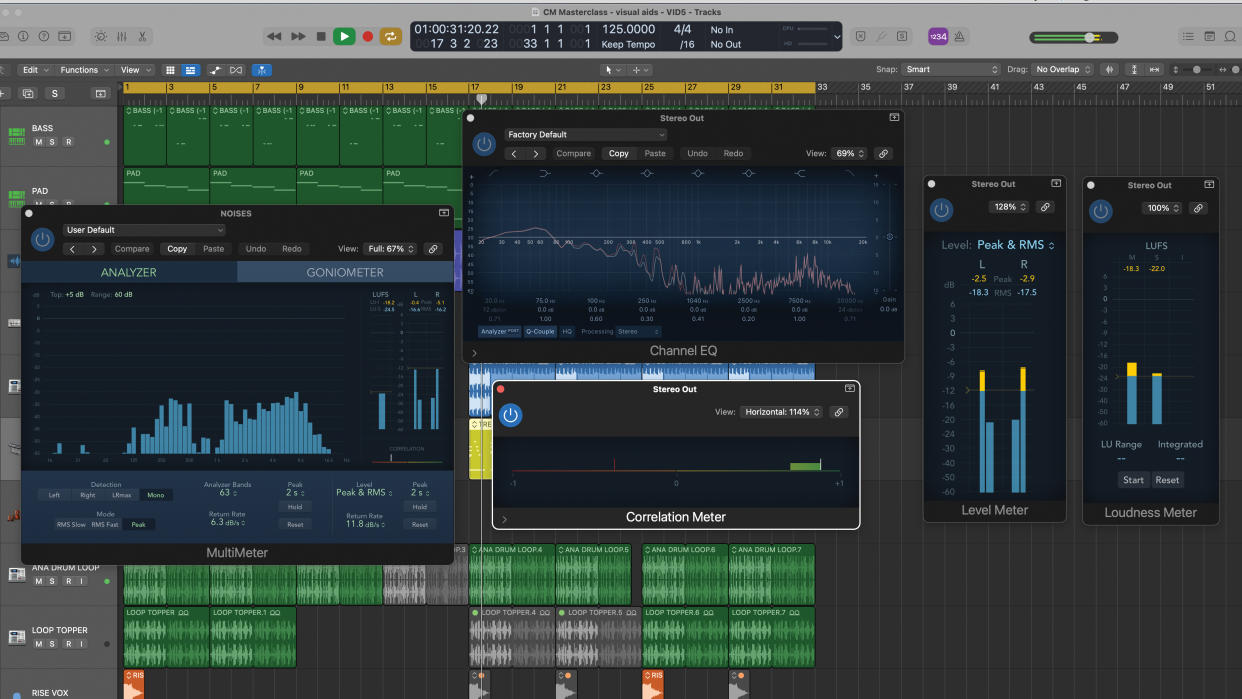
Here we’ve loaded up a combined peak and RMS meter on the main mix output. The RMS level will be lower than the peak level, as it is here. What’s of interest to us is by how much it’s lower and also how much variation there is. Here you can see the RMS value is about -15dB and peak about -1.5dB.
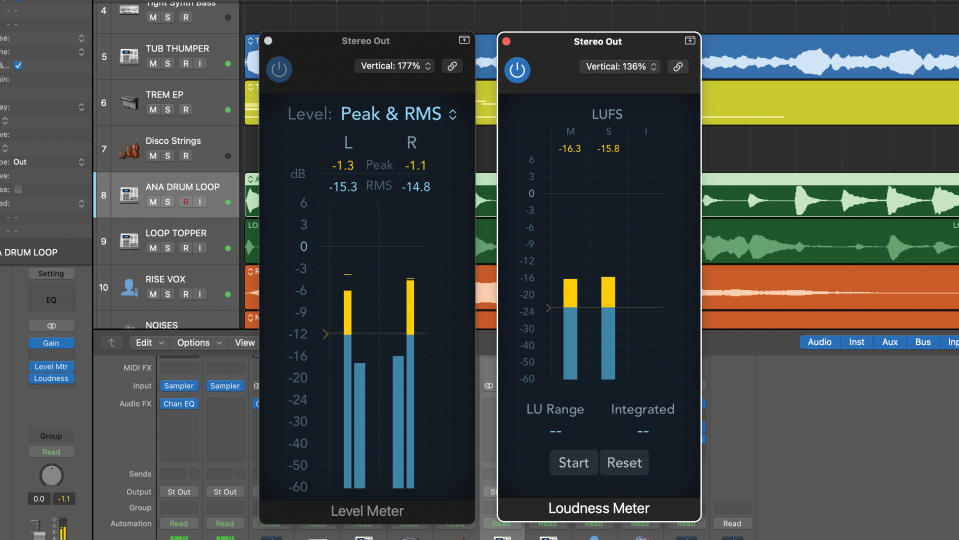
Although our RMS meter is helpful, it’s a real-time meter based on average power. To get an even more accurate sense of how loud a track or our mix is, we can use what’s called an average or ‘integrated’ reading on a LUFS (loudness units to full scale) meter, where the scale is based on perceived loudness.
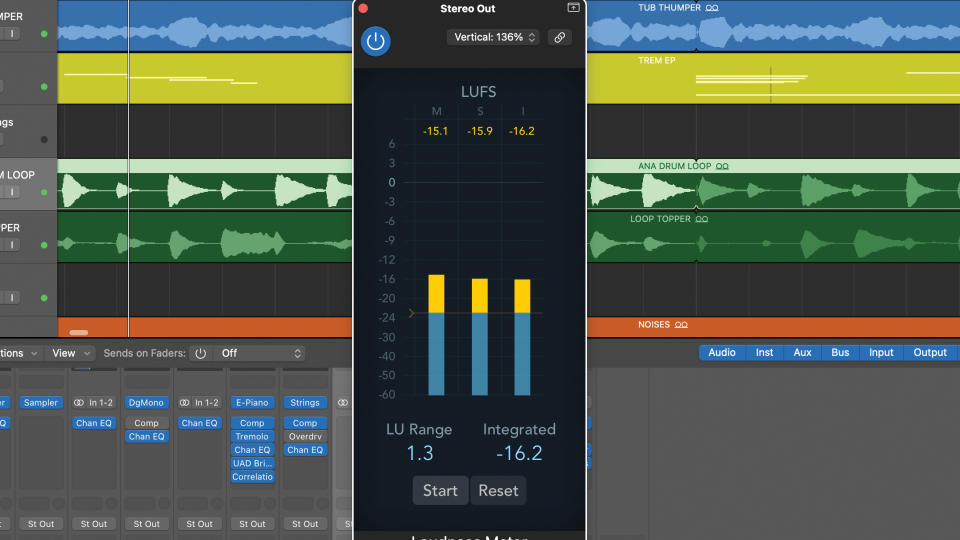
LUFS meters include momentary, short term and integrated level readings as well as some level ranges, all of which can be handy. When mixing, the integrated reading can really help. Here you can see the meter has a Start option at the bottom, allowing us to collect an average level for various parts of the track.
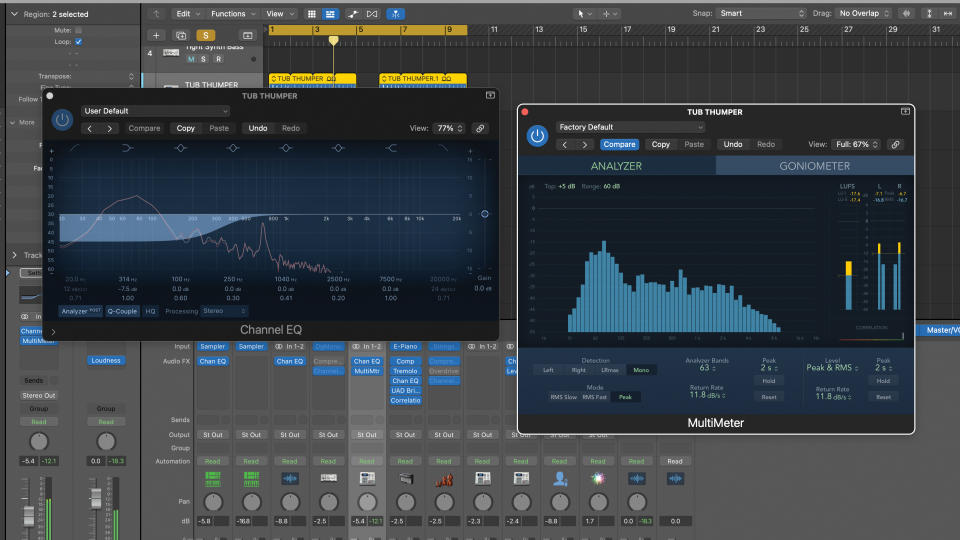
Next up, spectrum analysers. These provide a real-time plot of amplitude against frequency and are often incorporated into EQs. They are usually line curves, sometimes have adjustable precision and may also have a zoom option. Other formats include multiband graphs, which you can also see in the grab.
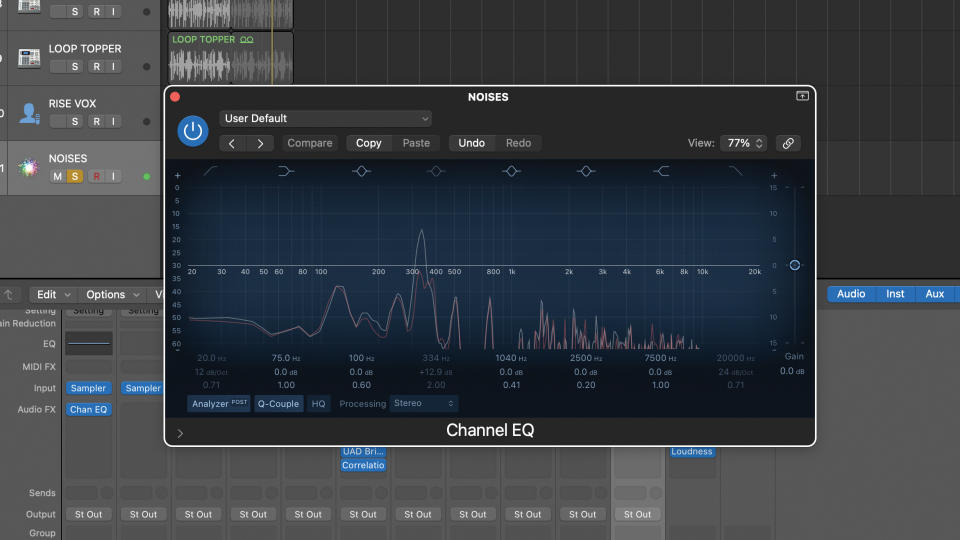
For audible frequencies, the spectrum analyser is a great second line tool. If for example you can hear a prominent and maybe undesirable tone in a sound, a quick look at the analyser can help reveal where the tone is. Here we can hear and see a dominant frequency at about 350Hz, and can then choose a plan of action.
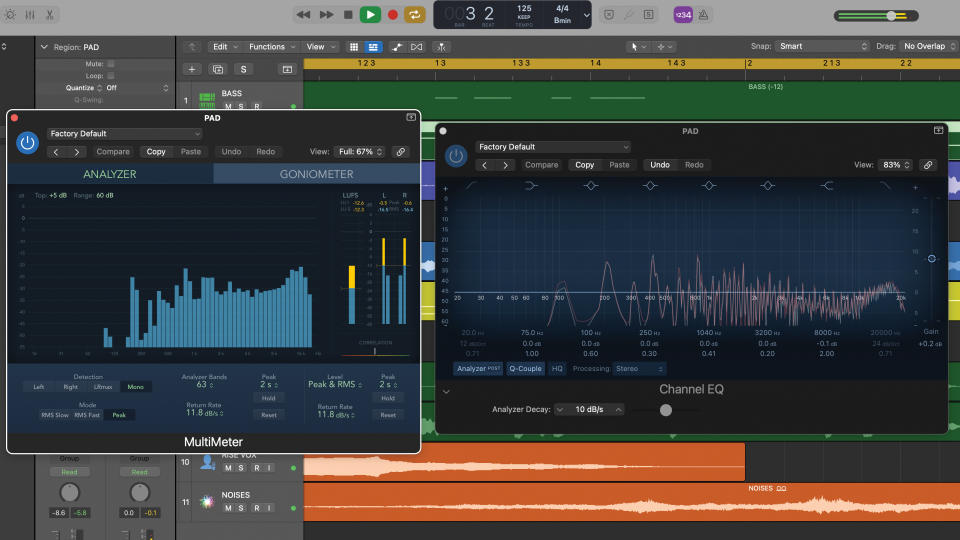
Spectrum analysers can also be ideal for handling frequencies that are harder to hear. This can be great for keeping an eye on low and sub-bass behaviour but also very high frequencies too. Here we have a keyboard sound with an unusual high frequency peak and the analyser helps us see its frequency region.
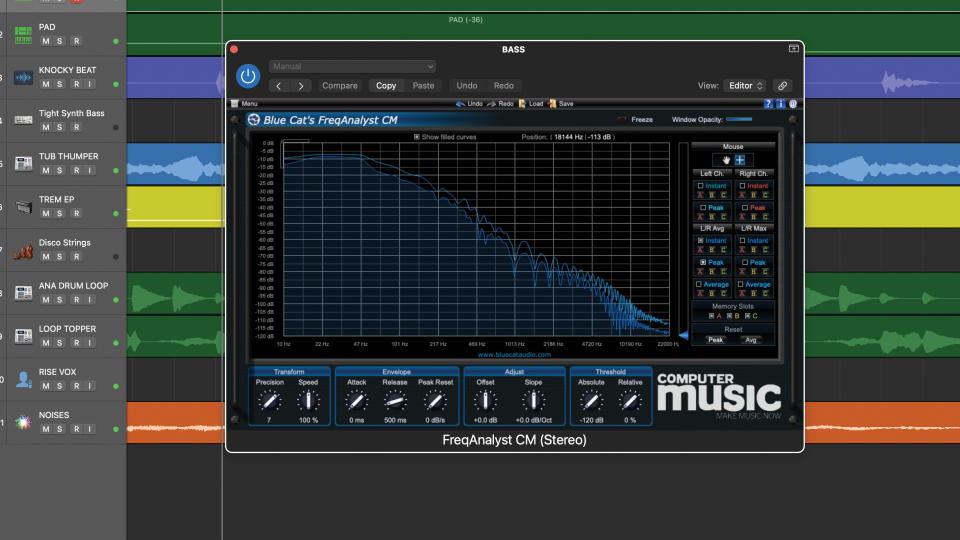
Next up, looking at this bass sound on the analyser shows there are a lot of low and sub frequencies in the sound. Typically we would handle this using a high-pass filter. Here, using our EQ analyser in post-EQ mode, we can also see the outcome and adjust the filter cutoff and slope to taste.
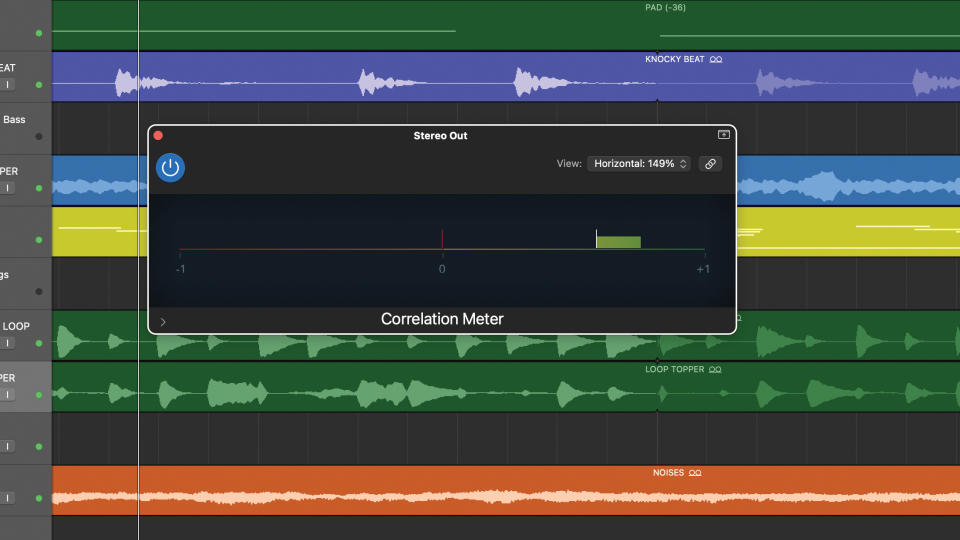
Finally, correlation meters. These show the phase relationship between left/right stereo channels. A mono mix shows as fully positive (+1 on our example). A fully negative reading occurs if left and right are identical but one is phase inverted. Typically, a mix will meter as positive. However, we may have elements that meter negative.
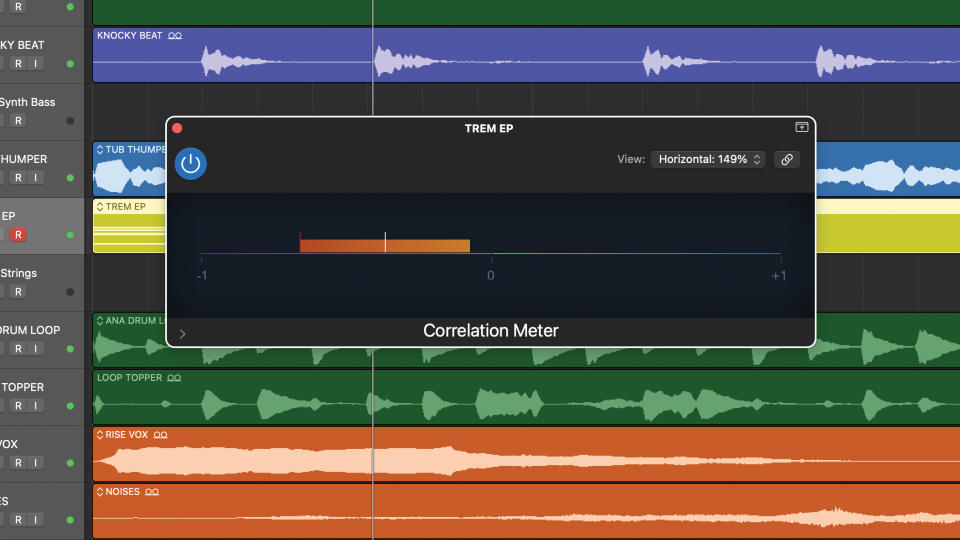
Some mix elements may have artificial width enhancement that causes this. If when we listen in mono, elements disappear or decrease substantially in level it can be handy to use the correlation meter on those elements to assess by how much the channels are out of phase and how this changes over time, then we can solve it.
Pro tips
1. Try using a goniometer
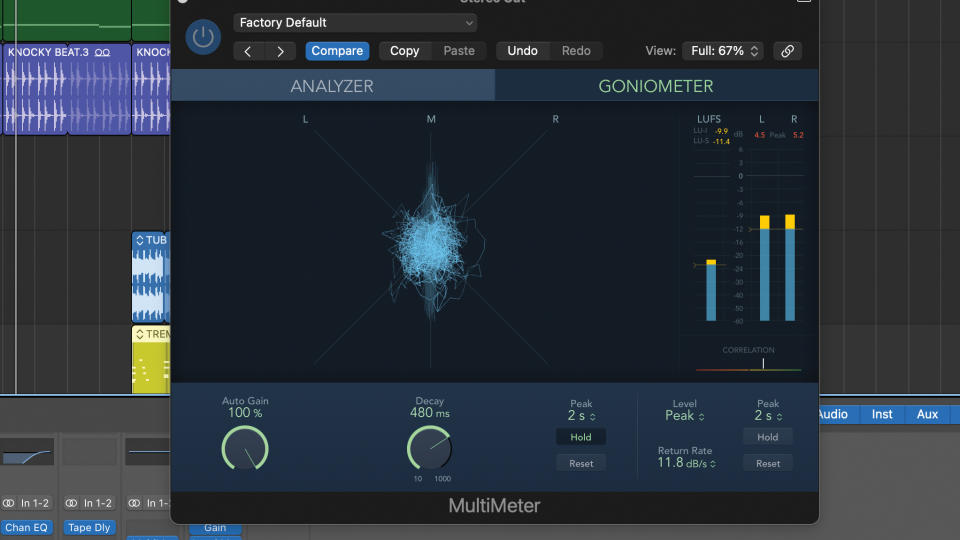
The Lissajous display or audio goniometer is a highly intuitive display that can help you interpret phase, level and to some degree frequency content. Left and right channel levels are plotted such that a hard-panned signal appears as a 45 degree straight line either side of the vertical line.
This means a totally mono single on a stereo output will produce a vertical line. Level differences between channels and overall levels dictate the width and overall size of the plot. A full frequency stereo mix results in a fast dynamic display that looks like a ball of string.
2. Spatial formats require different tools
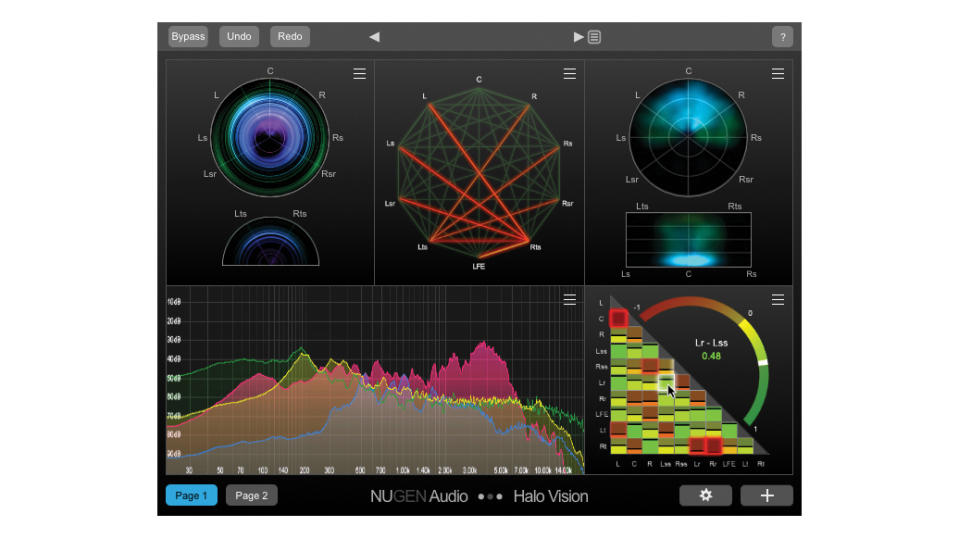
Should you find yourself mixing for multi speaker formats such as Dolby Atmos, the number of channels create new demands for your meters. To put this into some kind of context, each of your outputs will have some kind of correlation relationship with each other. Statistically speaking, that’s quite an uplift on stereo where you’re only concerned about the correlation between two channels.
In practical terms, you’re unlikely to experience strong correlation issues across multiple pairs. However, keeping track of things is still important, and making use of surround-equipped metering such as Nugen’s Halo Vision could be a wise move.
Recommended listening
1. Sam Smith & Kim Petras - Unholy
If you’re aiming for a wide and impactful contemporary mix like this, your metering tools can really help.
2. Metallica - The Day That Never Comes
Use metering to help improve your mix loudness, then it won’t need to be slammed in mastering, as heard in this example.

