Trillions and Trillions: 'Media Cartographer' Evan Shapiro Maps the Known Media Universe (Mind-blowing Graphic of The Day)
You may not know this, but I create maps of the Media Universe. I started charting the Media ecosystem just three years ago this August. I suspect people think it’s been longer. It does feel that way, to be honest. Maybe that’s because I’ve updated my map more than 55 times over the last three years.
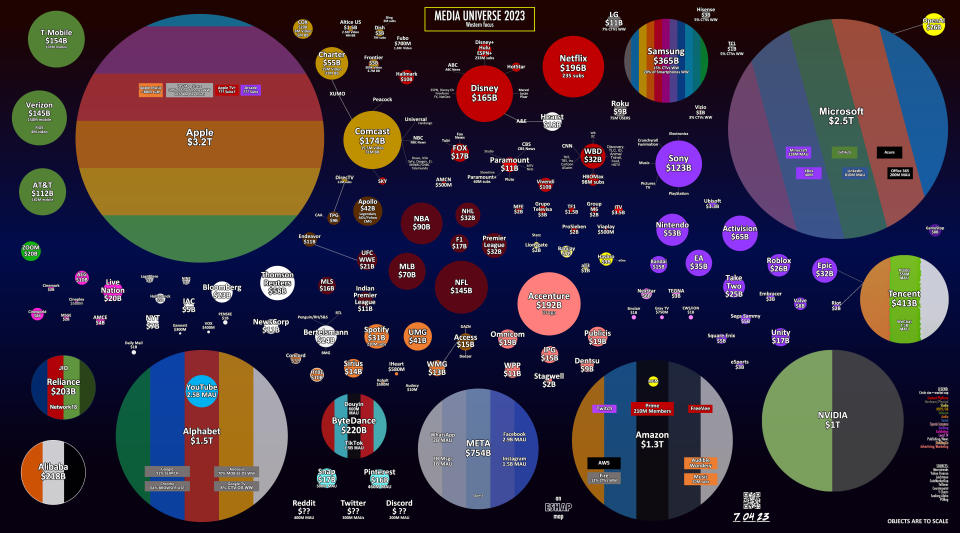
It’s the first map ever with Apple valued at more than $3 trillion and NVIDIA over the $1 trillion market cap (now worth more than Meta).
I am biased. And this is my favorite version yet. It’s also the last map I’ll create before totally redesigning it over the summer. (Click on the multi-directional arrow icon in the top right corner of the graphic to expand it to full screen.)
This fall, I’ll be speaking at the Royal Television Society, IBC, Medientage Munich, MIPCOM, THIS Conference and NAB. With all these events, and so many smart people watching, I am feeling extra pressure to change things up -- kind of the same way the Media industry is feeling about itself these days.
After charting this course for three years, this summer we’re trying to look at this map, and the ecosystem it represents, differently. The goal is, as always, increased perspective based on the data -- to offer you a view of this arena from a new angle.
If you want to see specifically how this map has changed since 2020 -- starting with the first one -- high res versions of maps from the last three years, including this latest one, are available at this link.
If you want to know what the new view looks like, stay tuned this fall.

