TODAY'S CHARTS: Risks of a flat yield curve in 2018

The most important chart you need to know today is the yield curve. But don’t yawn, it has huge implications for the economy and your portfolio.
Over the past year, short-term rates have surged while long-term rates have held steady, sending the yield curve to its flattest levels in a decade.
Now Morgan Stanley analysts predict the curve will be completely flat by 2018.

Morgan Stanley’s Matthew Hornbach explains that as the Fed continues to gradually raise rates, it puts upward pressure on short-term yields. Concurrently, as global central banks expand their balance sheets, that puts downward pressure on long-term rates. Both those phenomena working in tandem will cause the curve to flatten such that, “in 3Q18, all Treasury yields will be in the lower end of that 2.00-2.25% range.”
“If growth is better than expected, we think short-end rates rise more,” Hornbach writes. “If growth weakens more, or sooner, we expect strong demand for U.S. duration,” which will weigh on long-term rates.
What are the market effects?
One of Morgan Stanley’s top trades is to bet on the shrinking spread between 2 and 30-year Treasury yields, targeting an eventual spread of 10 basis points (currently, it’s 58 bps).
Also, a flattening yield curve spells trouble for banks, which generate money from the gap between long-term loans and short term deposits. So it’s no surprise that financial stocks (XLF) have trailed the S&P 500 (^GSPC, SPY) this year.
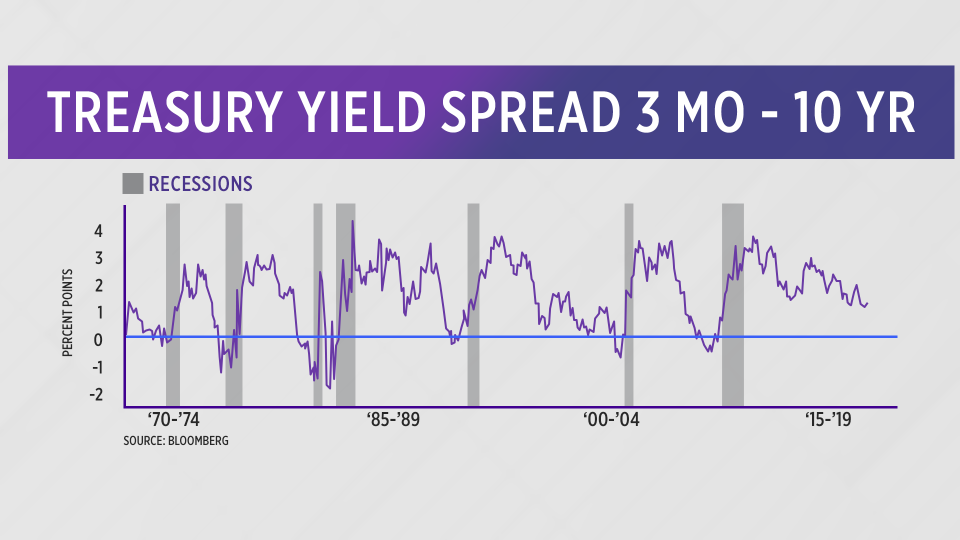
Finally, an inverted yield curve has predicted the past 7 recessions. Flattening isn’t the same thing as inverting, but it is one step closer. Morgan Stanley notes that “we are not on recession watch now, and peg the 12-month probability of recession at 25% … [but] by 2020, that probability grows to near certainty.”
