Stock market news: August 14, 2019
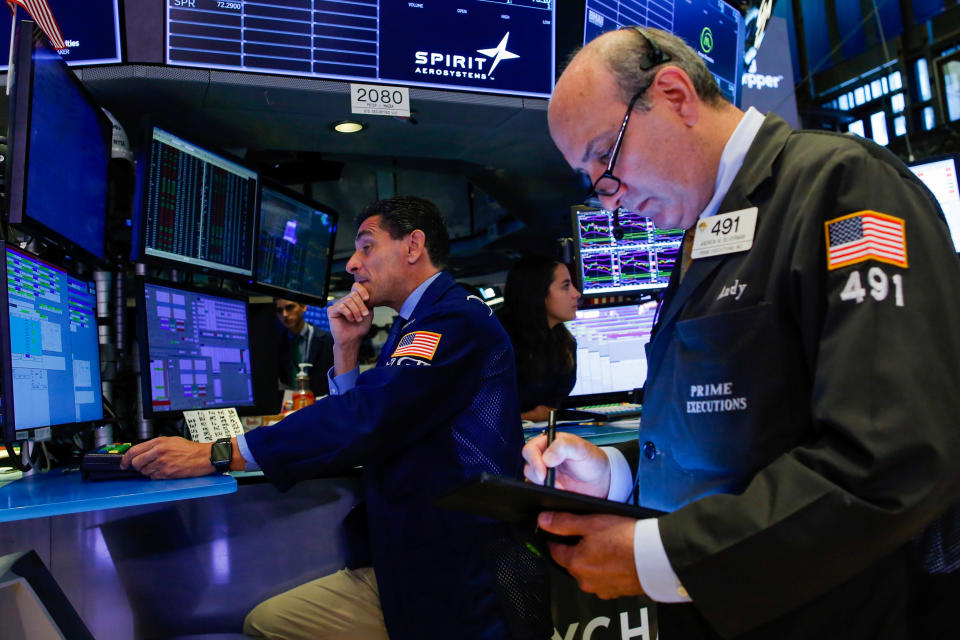
Stocks plunged on Wednesday with the Dow Jones Industrial Average booking its worst single-day of trading for the year. Markets initially turned sharply lower after the U.S. bond market flashed its brightest warning signal yet presaging a potential recession.
Here were the main moves in the market, as of 4:00 p.m. ET:
S&P 500 (^GSPC): -2.93%, or 85.72 points
Dow (^DJI): -3.05%, or 800.49 points
Nasdaq (^IXIC) : -3.02%, or 242.42 points
10-year Treasury yield (^TNX): -9.1 bps to 1.589%
U.S. dollar to onshore Chinese yuan rate (CNY=X): -0.2429% to 7.0223
The yield on the 2-year U.S. Treasury note rose above that of the 10-year U.S. Treasury around 6 a.m. ET Wednesday, marking the first inversion of this closely watched portion of the yield curve in more than a decade.
Inversions of the yield curve – or when shorter-term yields rise above longer-term yields – are taken as bearish signals, since they indicate investors have less confidence in the short-term outlook and are instead bidding up Treasurys on the longer end of the curve. On Wednesday, the 30-year yield sank to as low as 2.025% during intraday trading, according to CBOE data, reaching the lowest level on record.
[Read more: Recession indicator flashes red for the first time since 2005]
An inversion between the 2-year and 10-year yields is especially widely viewed as a reliable recessionary harbinger. This particular occurrence follows an inversion of the 3-month and 5-year Treasury yields, which first inverted in December, as well as an ongoing inversion of the 3-month and 10-year Treasury yields.
Ahead of the Great Recession, the curve between the 2-year and 10-year yields first inverted in late 2005, before wavering in and out of an inversion for the next two years into the start of the recession, which officially began in December 2007.
Wednesday afternoon, President Donald Trump weighed in with a Twitter post, recapitulating his attack on the Federal Reserve and Fed Chair Jerome Powell and assailing the “crazy inverted yield curve.”
..Spread is way too much as other countries say THANK YOU to clueless Jay Powell and the Federal Reserve. Germany, and many others, are playing the game! CRAZY INVERTED YIELD CURVE! We should easily be reaping big Rewards & Gains, but the Fed is holding us back. We will Win!
— Donald J. Trump (@realDonaldTrump) August 14, 2019
The yield curve for U.S. Treasurys has flattened recently as concerns over global growth and U.S.-China trade uncertainty weighed on investor sentiment. On Wednesday, signs of a slowdown abroad mounted further, with new data showing output in China’s key industrial sector fell to a more than 17-year low, amid an ongoing trade war with the U.S.
The Federal Reserve’s rate cut in July – intended to help support the domestic economy in the face of growing risks to the outlook – provided an only marginal steepening of the yield curve, bringing more policy-sensitive shorter-term yields down closer to the targeted federal funds rate.
Bank shares headed the sell-off in stocks on Wednesday as investors considered the difficulty financial institutions would have bringing in profits in a lower-rate scenario. The Financial Select Sector SPDR Fund (XLF) dropped 3.7% by the end of trading Wednesday, as shares of component companies including Bank of America (BAC), JPMorgan Chase (JPM) and Goldman Sachs (GS) sank.

An inversion of the 2-year and 10-year yields tends to presage a peak in equity markets before a recession-related drop, Bank of America Merrill Lynch analysts wrote in a note Wednesday. The timing of this phenomenon, however, has historically varied.
It can take anywhere from a couple of months to around two years for an S&P 500 peak after an inversion, based on BAML’s analysis of past 2s10s inversions spanning back to 1956.
“The equity market is on borrowed time after the yield curve inverts,” the analysts wrote. “However, after an initial post-inversion dip, the S&P 500 can rally meaningfully prior to a bigger U.S. recession related drawdown.”
Initial post-inversion drawdowns are about 5.2% on average and generally last one to two months, the BAML analysts said, but can then lead into a “meaningful last gasp rally.”
“This rally has averaged 16.7% (12.4% median) with a range of 2.0% (1965) to 28.5% (1989) and lasts 6.7 months on average (2.8 median) with a range of 0.9 to 16.5 months,” the analysts wrote.
The 2s10s inversion on Wednesday sent equities into sharp reversal after an announcement by the Trump administration to delay 10% tariffs on some goods past the original September 1 deadline buoyed stocks Tuesday.
—
Emily McCormick is a reporter for Yahoo Finance. Follow her on Twitter: @emily_mcck
Read more from Emily:
Economy adds 164,000 jobs in July, unemployment rate sits at 3.7%
Netflix’s 2Q global paid subscriber additions miss expectations
Tech companies like Lyft want your money – not ‘your opinion’
Follow Yahoo Finance on Twitter, Facebook, Instagram, Flipboard, LinkedIn, and reddit.
Read the latest financial and business news from Yahoo Finance


