Are Poor Financial Prospects Dragging Down Mullen Group Ltd. (TSE:MTL Stock?
It is hard to get excited after looking at Mullen Group's (TSE:MTL) recent performance, when its stock has declined 6.9% over the past month. We decided to study the company's financials to determine if the downtrend will continue as the long-term performance of a company usually dictates market outcomes. Particularly, we will be paying attention to Mullen Group's ROE today.
Return on equity or ROE is a key measure used to assess how efficiently a company's management is utilizing the company's capital. In short, ROE shows the profit each dollar generates with respect to its shareholder investments.
Check out our latest analysis for Mullen Group
How Do You Calculate Return On Equity?
The formula for return on equity is:
Return on Equity = Net Profit (from continuing operations) ÷ Shareholders' Equity
So, based on the above formula, the ROE for Mullen Group is:
7.1% = CA$64m ÷ CA$896m (Based on the trailing twelve months to December 2020).
The 'return' is the yearly profit. One way to conceptualize this is that for each CA$1 of shareholders' capital it has, the company made CA$0.07 in profit.
What Has ROE Got To Do With Earnings Growth?
So far, we've learned that ROE is a measure of a company's profitability. We now need to evaluate how much profit the company reinvests or "retains" for future growth which then gives us an idea about the growth potential of the company. Generally speaking, other things being equal, firms with a high return on equity and profit retention, have a higher growth rate than firms that don’t share these attributes.
Mullen Group's Earnings Growth And 7.1% ROE
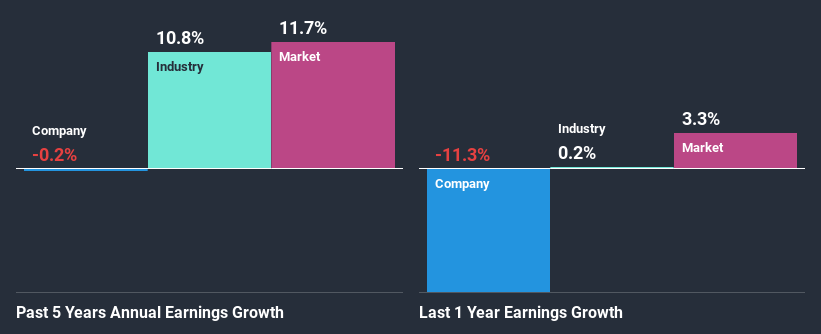
When you first look at it, Mullen Group's ROE doesn't look that attractive. We then compared the company's ROE to the broader industry and were disappointed to see that the ROE is lower than the industry average of 15%. As a result, Mullen Group's flat net income growth over the past five years doesn't come as a surprise given its lower ROE.
We then compared Mullen Group's net income growth with the industry and found that the average industry growth rate was 11% in the same period.
The basis for attaching value to a company is, to a great extent, tied to its earnings growth. What investors need to determine next is if the expected earnings growth, or the lack of it, is already built into the share price. By doing so, they will have an idea if the stock is headed into clear blue waters or if swampy waters await. Has the market priced in the future outlook for MTL? You can find out in our latest intrinsic value infographic research report.
Is Mullen Group Using Its Retained Earnings Effectively?
The high three-year median payout ratio of 64% (meaning, the company retains only 36% of profits) for Mullen Group suggests that the company's earnings growth was miniscule as a result of paying out a majority of its earnings.
In addition, Mullen Group has been paying dividends over a period of at least ten years suggesting that keeping up dividend payments is way more important to the management even if it comes at the cost of business growth. Our latest analyst data shows that the future payout ratio of the company is expected to rise to 85% over the next three years. However, the company's ROE is not expected to change by much despite the higher expected payout ratio.
Conclusion
On the whole, Mullen Group's performance is quite a big let-down. The company has seen a lack of earnings growth as a result of retaining very little profits and whatever little it does retain, is being reinvested at a very low rate of return. With that said, we studied the latest analyst forecasts and found that while the company has shrunk its earnings in the past, analysts expect its earnings to grow in the future. To know more about the latest analysts predictions for the company, check out this visualization of analyst forecasts for the company.
This article by Simply Wall St is general in nature. It does not constitute a recommendation to buy or sell any stock, and does not take account of your objectives, or your financial situation. We aim to bring you long-term focused analysis driven by fundamental data. Note that our analysis may not factor in the latest price-sensitive company announcements or qualitative material. Simply Wall St has no position in any stocks mentioned.
Have feedback on this article? Concerned about the content? Get in touch with us directly. Alternatively, email editorial-team (at) simplywallst.com.

