The past five years for Restaurant Group (LON:RTN) investors has not been profitable
Long term investing works well, but it doesn't always work for each individual stock. It hits us in the gut when we see fellow investors suffer a loss. For example, we sympathize with anyone who was caught holding The Restaurant Group plc (LON:RTN) during the five years that saw its share price drop a whopping 89%. We also note that the stock has performed poorly over the last year, with the share price down 64%. The falls have accelerated recently, with the share price down 29% in the last three months. We really feel for shareholders in this scenario. It's a good reminder of the importance of diversification, and it's worth keeping in mind there's more to life than money, anyway.
It's worthwhile assessing if the company's economics have been moving in lockstep with these underwhelming shareholder returns, or if there is some disparity between the two. So let's do just that.
See our latest analysis for Restaurant Group
While markets are a powerful pricing mechanism, share prices reflect investor sentiment, not just underlying business performance. One flawed but reasonable way to assess how sentiment around a company has changed is to compare the earnings per share (EPS) with the share price.
Restaurant Group became profitable within the last five years. However, it made a loss in the last twelve months, suggesting profit may be an unreliable metric at this stage. Other metrics may better explain the share price move.
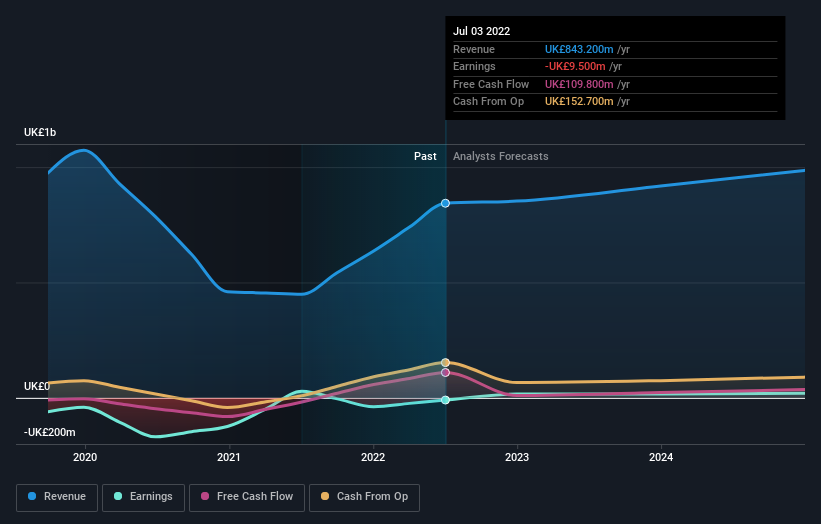
The revenue fall of 2.4% per year for five years is neither good nor terrible. But it's quite possible the market had expected better; a closer look at the revenue trends might explain the pessimism.
You can see how earnings and revenue have changed over time in the image below (click on the chart to see the exact values).
We consider it positive that insiders have made significant purchases in the last year. Even so, future earnings will be far more important to whether current shareholders make money. If you are thinking of buying or selling Restaurant Group stock, you should check out this free report showing analyst profit forecasts.
What About The Total Shareholder Return (TSR)?
We'd be remiss not to mention the difference between Restaurant Group's total shareholder return (TSR) and its share price return. The TSR attempts to capture the value of dividends (as if they were reinvested) as well as any spin-offs or discounted capital raisings offered to shareholders. Restaurant Group's TSR of was a loss of 84% for the 5 years. That wasn't as bad as its share price return, because it has paid dividends.
A Different Perspective
We regret to report that Restaurant Group shareholders are down 64% for the year. Unfortunately, that's worse than the broader market decline of 14%. However, it could simply be that the share price has been impacted by broader market jitters. It might be worth keeping an eye on the fundamentals, in case there's a good opportunity. Regrettably, last year's performance caps off a bad run, with the shareholders facing a total loss of 13% per year over five years. Generally speaking long term share price weakness can be a bad sign, though contrarian investors might want to research the stock in hope of a turnaround. It's always interesting to track share price performance over the longer term. But to understand Restaurant Group better, we need to consider many other factors. For instance, we've identified 1 warning sign for Restaurant Group that you should be aware of.
Restaurant Group is not the only stock that insiders are buying. For those who like to find winning investments this free list of growing companies with recent insider purchasing, could be just the ticket.
Please note, the market returns quoted in this article reflect the market weighted average returns of stocks that currently trade on GB exchanges.
Have feedback on this article? Concerned about the content? Get in touch with us directly. Alternatively, email editorial-team (at) simplywallst.com.
This article by Simply Wall St is general in nature. We provide commentary based on historical data and analyst forecasts only using an unbiased methodology and our articles are not intended to be financial advice. It does not constitute a recommendation to buy or sell any stock, and does not take account of your objectives, or your financial situation. We aim to bring you long-term focused analysis driven by fundamental data. Note that our analysis may not factor in the latest price-sensitive company announcements or qualitative material. Simply Wall St has no position in any stocks mentioned.
Join A Paid User Research Session
You’ll receive a US$30 Amazon Gift card for 1 hour of your time while helping us build better investing tools for the individual investors like yourself. Sign up here
