Netflix Is Revising Its Binge-Viewing Playbook | Charts
- Oops!Something went wrong.Please try again later.
- Oops!Something went wrong.Please try again later.
- Oops!Something went wrong.Please try again later.
It wasn’t that long ago that Netflix put “binge-watching” in the dictionary: The viewership model it both created and made popular was Collins’ word of the year in 2015.
Now Netflix might be searching for a thesaurus instead. Though new seasons of most of its originals are still released all at once, the ever-experimental streaming giant has been moving toward two-part premieres for its biggest shows, which have most recently included “The Witcher” and “The Lincoln Lawyer.” Could “split seasons” be the byword now?
“Most popular streaming shows get 75% of views in the first 15 days,” said Samba TV CEO Ashwin Navin. That makes the timing and manner of a debut a crucial question.
That may be why “Money Heist” did the split. “Stranger Things,” “Ozark” and “You” have all done it. And with the two-part premiere of “Virgin River” Season 5 on the horizon, it’s a trend that’s only picking up steam.
The idea behind swapping an all-at-once release for a two-part premiere makes sense on paper. But while there’s reason to believe these divided seasons may increase social media impact, they are also leading to lower completion rates. It’s a strategy, in other words, that can boost buzz at the cost of binges.

Defining streaming “success”
There’s no consensus on what makes a show successful in the streaming age. Is it high completion rates? Huge amounts of hours viewed? Impressions on TikTok and X? Or loyal fans?
According to Navin, the answer is basically all of the above.
“To win in today’s competitive market, streamers need a trifecta: engaged viewers who watch full seasons of their shows, remain loyal to the service and don’t churn, plus the social buzz that attracts new audiences,” he told TheWrap.
Navin noted that social impact was “crucial” for growth as well as subscriber retention. “Viral moments like the ‘Goo Goo Muck’ dance in Netflix’s ‘Wednesday’ extend the shelf life of a show,” Navin said.
Social buzz isn’t an end in and of itself, but it “can help completion rates and drive new viewers” to the show or the streamer, Navin said.
Splits on the rise
Netflix’s two-part trend didn’t really take off until around 2021. That year Netflix released both “Money Heist” Part 5 and “Lupin” Season 1 in two-part installments.
Because Netflix only started sharing its weekly Top 10 lists in November 2021, it’s difficult to tell how this divided season of “Money Heist” performed compared to previous installments. And since “Lupin” premiered in two parts, previous metrics aren’t comparable. Netflix didn’t respond to multiple requests for comment for this story.
Regardless, it makes sense that Netflix would experiment with this shifted release schedule, particularly for its bigger shows. Before, a highly anticipated and expensive new season of a beloved show like “Orange Is the New Black” would spark interest for a couple of weeks before fading into the pop culture background. It stands to reason that two release dates rather than one would double a show’s chances of staying in mainstream conversation.
At least from a social media point of view, this model seems to have some merit.
More mentions
While social networks have tightened up on data access, Google Trends serves as a good proxy for a series’ relative popularity. Here’s what that data looked like for all seven seasons of “Orange Is the New Black.”

This graph is fairly typical for a regular full-season premiere of a popular Netflix series. There are prominent spikes around the days new seasons drop with equally sharp dips in interest. Only Seasons 6 and 7 didn’t follow that trend, likely owing to the slow-burn nature of Season 6 and a renewed interest in the series ahead of its final season.
Comparatively, major shows that have implemented two-part releases have seen longer windows of interest on Google Trends. Take “Stranger Things,” “Ozark” and “Money Heist”:

Despite its July premiere date, “Stranger Things” did see a substantial bump in interest around November 2016. That could be credited to Netflix pushing the series around Halloween and the Thanksgiving holiday, or because the series took a few months to turn into a real streaming juggernaut. But Seasons 2 and 3 follow the same basic pattern of “Orange Is the New Black”: a sharp spike in interest around the time of a new premiere date, followed by an equally sharp decline.
That’s not the case when it comes to “Stranger Things” Season 4, which gained popularity in June 2022 when the first part of Season 5 premiered, and again in July 2022 upon the release of the second part.
The same can be said of “Money Heist” and “Ozark.” Both series saw sharp spikes in interest around the release of a new season. Yet in their final seasons, both experienced two bumps of search interest in the same year, aligning with the two release dates for their final seasons.
The few metrics Netflix has publicly shared back the idea that multiple premieres lead to more time in the watercooler spotlight. Both “Stranger Things” Season 4 and “You” Season 4 seemed to spend more time on Netflix’s weekly Top 10 list thanks to their divided premieres. (Netflix has since changed its views metric, but in this article, we’re using the historical hours viewed data the company released.)
Three days after the first seven episodes of “Stranger Things” Season 4 were released on May 27, 2022, the thriller topped the streamer’s global top 10 TV list with 287 million hours. It remained No. 1 for a total of four weeks.
In fact, there was only one week between the premieres when the series wasn’t in the No. 1 slot. Season 3 of “The Umbrella Academy” overtook that coveted position the week of June 20-26, 2022. Right when “Stranger Things” was at risk of losing its top spot, the season’s two remaining episodes dropped. After that premiere, “Stranger Things” returned as Netflix’s No.1 English-language series for an additional three weeks.
The same trend appears when it comes to “You” Season 4, the hit drama’s first season to be divided into two parts. As with “Stranger Things” Season 4, “You” premiered both halves of its two-part season within a month of each other. When the first five episodes premiered on Feb. 9, “You” quickly ascended to the No. 1 spot on Netflix’s top 10 English-language TV list. That week, it raked in 92.1 million hours viewed.
But Joe Goldberg only kept the No. 1 spot for two weeks. Starting the week of Feb. 20, “You” was overtaken by “Outer Banks” Season 3, which held onto that spot for two weeks in a row. It’s only when “You” returned with the back half of Season 4 that the show returned to the No. 1 spot. Arguably, the two-part premiere model secured “You” four weeks as the No. 1 show instead of two.
That’s not the whole story, though. While splitting seasons seems to lift search interest and Netflix’s own rankings release shift may benefit search interest and Netflix’s own rankings, hours viewed and completion rates tell a more dubious story.

Fewer finish
It’s hard to say if these two-part premieres have increased or decreased viewership season over season, simply because there are not many usable examples.
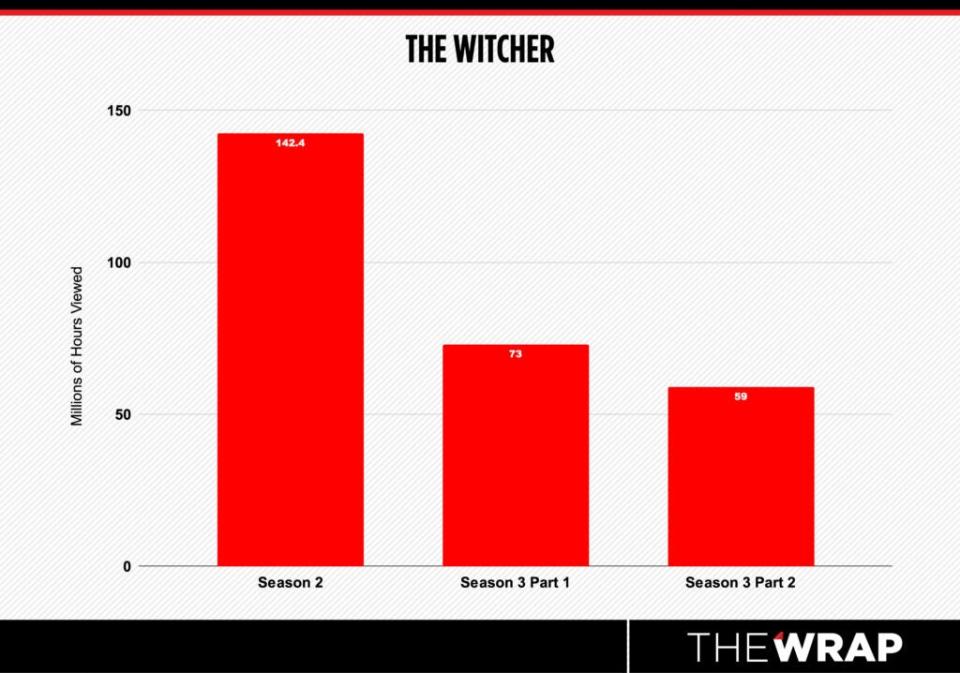
Netflix did release statistics about select shows before the launch of its Top 10 list in November 2021. But because of the streamer’s changing methodology, it’s pointless to compare those past statistics with the ones Netflix uses now. There are, however, two shows that both premiered new seasons after the implementation of the Top 10 list in 2021 that were also released as a two-part season: “The Witcher” and “The Lincoln Lawyer.”
Based on Netflix’s metrics, “The Witcher” Season 2 generated 142 million hours viewed during its first week. The series’ two-part premiere of Season 3 appeared to have led to an overall drop in viewership. During its first week on Netflix, Season 3, Part 1, drew 73 million hours, and Part 2 drew 59 million hours.
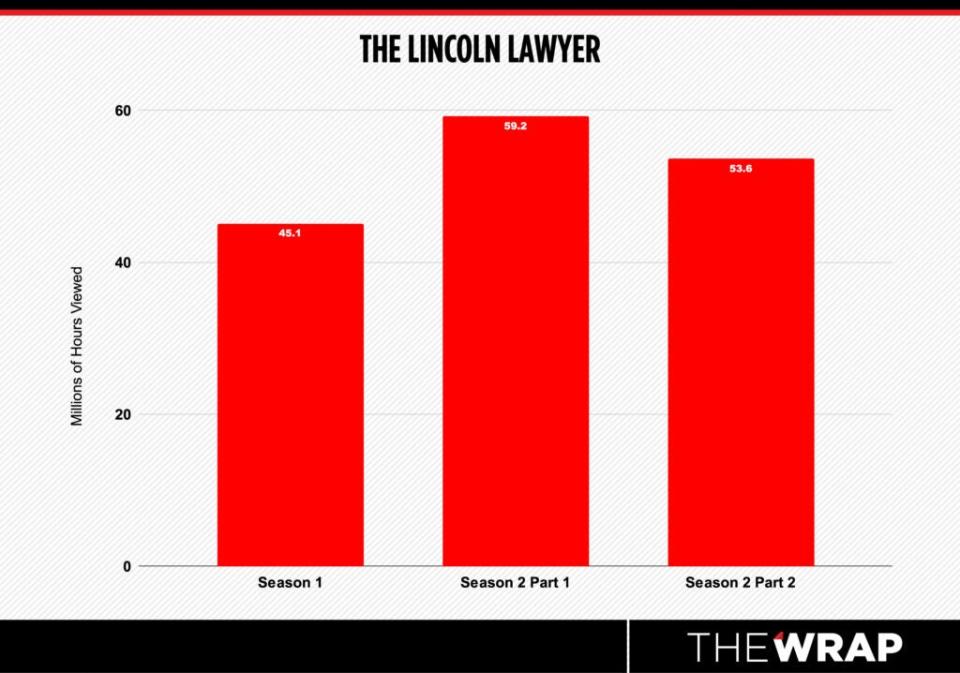
That wasn’t the case for “The Lincoln Lawyer” Season 2. Whereas Season 1 only saw 45 million hours viewed in its first week, the numbers for Season 2 Part 1 alone bested the series’ first season. “The Lincoln Lawyer” had 59 million hours during the first week of Part 1 and 53 million hours during the first week of Part 2.
There may be reasons for the season-to-season drop that have little to do with scheduling. A well-loved series typically sees a jump in viewership around Season 2, which would explain “The Lincoln Lawyer’s” rise. As for “The Witcher,” the series’ third season wasn’t as well-received as its second, earning a 78% on Rotten Tomatoes compared to Season 2’s 95%. That decline, along with Henry Cavill’s planned departure from the series, may have attributed to a drop in viewership.
But there is another way to measure a series’ success: completion rates. According to an analysis from PlumResearch, the rise of two-part premieres may be leading to fewer viewers watching a season all the way through.
PlumResearch pulls data from its Show Labs audience measurement software, which covers all major streamers and reports on data from roughly a quarter of a million households. It’s device-agnostic, which means that if a viewer starts watching “Stranger Things” on a laptop and then moves to a TV, PlumResearch is able to track that.
Based on the company’s research, the completion rate for Part 1 of “Stranger Things” Season 4 was 68.3% in the 28 days after its premiere. That completion rate dropped to 63.9% at the 90-day mark, roughly two months after the full season had been made available.
Compared to Season 4, the completion rates for Seasons 2 and 3 were 71.8% and 71.7%, respectively.
“You” shows the same trend. According to PlumResearch, within the first 28 days that the first five episodes of Season 4 became available, the season saw a 68.3% completion rate by viewers. That number dropped to 44.6% at the 90-day mark. By that time, the full season had been available for roughly two months.
The other three seasons of “You” saw completion rates of 61.1%, 72.6% and 74.1%, respectively. Those first three seasons released all episodes at once rather than dividing the release. It’s worth noting, though, that a reason for Season 4’s sharp decline may have to do with the show’s creative direction. Many fans and critics of “You” complained about the back half of Season 4 while praising its front half.

Is the split working?
Based on the data available, it seems as though Netflix’s two-part premieres may be benefiting new seasons in terms of buzz, even if they’re hurting completion rates. The former helps drive new subscribers, while the latter is a measure of satisfaction among existing subscribers.
With Wall Street closely watching Netflix’s ability to sustain growth and churn remaining relatively low, buzz may outweigh binging, which means the experiment may well be working. With Netflix staying mum, though, the best indicator may be to watch for more split premieres.
The post Netflix Is Revising Its Binge-Viewing Playbook | Charts appeared first on TheWrap.

