Integrated Research Limited (ASX:IRI) Stock's Been Sliding But Fundamentals Look Decent: Will The Market Correct The Share Price In The Future?
It is hard to get excited after looking at Integrated Research's (ASX:IRI) recent performance, when its stock has declined 35% over the past three months. However, the company's fundamentals look pretty decent, and long-term financials are usually aligned with future market price movements. Particularly, we will be paying attention to Integrated Research's ROE today.
ROE or return on equity is a useful tool to assess how effectively a company can generate returns on the investment it received from its shareholders. Simply put, it is used to assess the profitability of a company in relation to its equity capital.
Check out our latest analysis for Integrated Research
How Is ROE Calculated?
The formula for ROE is:
Return on Equity = Net Profit (from continuing operations) ÷ Shareholders' Equity
So, based on the above formula, the ROE for Integrated Research is:
17% = AU$12m ÷ AU$75m (Based on the trailing twelve months to December 2020).
The 'return' is the profit over the last twelve months. One way to conceptualize this is that for each A$1 of shareholders' capital it has, the company made A$0.17 in profit.
What Has ROE Got To Do With Earnings Growth?
So far, we've learned that ROE is a measure of a company's profitability. Depending on how much of these profits the company reinvests or "retains", and how effectively it does so, we are then able to assess a company’s earnings growth potential. Generally speaking, other things being equal, firms with a high return on equity and profit retention, have a higher growth rate than firms that don’t share these attributes.
Integrated Research's Earnings Growth And 17% ROE
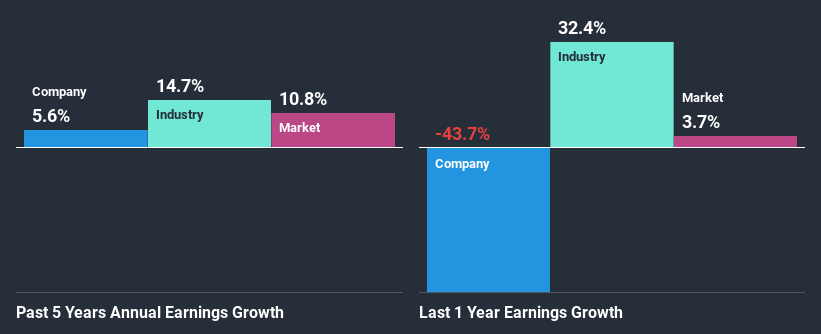
At first glance, Integrated Research seems to have a decent ROE. And on comparing with the industry, we found that the the average industry ROE is similar at 14%. This certainly adds some context to Integrated Research's moderate 5.6% net income growth seen over the past five years.
As a next step, we compared Integrated Research's net income growth with the industry and were disappointed to see that the company's growth is lower than the industry average growth of 15% in the same period.
Earnings growth is a huge factor in stock valuation. It’s important for an investor to know whether the market has priced in the company's expected earnings growth (or decline). By doing so, they will have an idea if the stock is headed into clear blue waters or if swampy waters await. One good indicator of expected earnings growth is the P/E ratio which determines the price the market is willing to pay for a stock based on its earnings prospects. So, you may want to check if Integrated Research is trading on a high P/E or a low P/E, relative to its industry.
Is Integrated Research Making Efficient Use Of Its Profits?
While the company did pay out a portion of its dividend in the past, it currently doesn't pay a dividend. We infer that the company has been reinvesting all of its profits to grow its business.
Our latest analyst data shows that the future payout ratio of the company over the next three years is expected to be approximately 50%. Still, forecasts suggest that Integrated Research's future ROE will rise to 20% even though the the company's payout ratio is not expected to change by much.
Conclusion
On the whole, we do feel that Integrated Research has some positive attributes. The company has grown its earnings moderately as previously discussed. Still, the high ROE could have been even more beneficial to investors had the company been reinvesting more of its profits. As highlighted earlier, the current reinvestment rate appears to be quite low. That being so, the latest analyst forecasts show that the company will continue to see an expansion in its earnings. To know more about the latest analysts predictions for the company, check out this visualization of analyst forecasts for the company.
This article by Simply Wall St is general in nature. It does not constitute a recommendation to buy or sell any stock, and does not take account of your objectives, or your financial situation. We aim to bring you long-term focused analysis driven by fundamental data. Note that our analysis may not factor in the latest price-sensitive company announcements or qualitative material. Simply Wall St has no position in any stocks mentioned.
Have feedback on this article? Concerned about the content? Get in touch with us directly. Alternatively, email editorial-team (at) simplywallst.com.

