Imagine Owning Axactor (OB:AXA) And Wondering If The 40% Share Price Slide Is Justified

In order to justify the effort of selecting individual stocks, it's worth striving to beat the returns from a market index fund. But its virtually certain that sometimes you will buy stocks that fall short of the market average returns. We regret to report that long term Axactor SE (OB:AXA) shareholders have had that experience, with the share price dropping 40% in three years, versus a market return of about 29%. The more recent news is of little comfort, with the share price down 25% in a year. More recently, the share price has dropped a further 16% in a month.
See our latest analysis for Axactor
In his essay The Superinvestors of Graham-and-Doddsville Warren Buffett described how share prices do not always rationally reflect the value of a business. One flawed but reasonable way to assess how sentiment around a company has changed is to compare the earnings per share (EPS) with the share price.
During five years of share price growth, Axactor moved from a loss to profitability. We would usually expect to see the share price rise as a result. So it's worth looking at other metrics to try to understand the share price move.
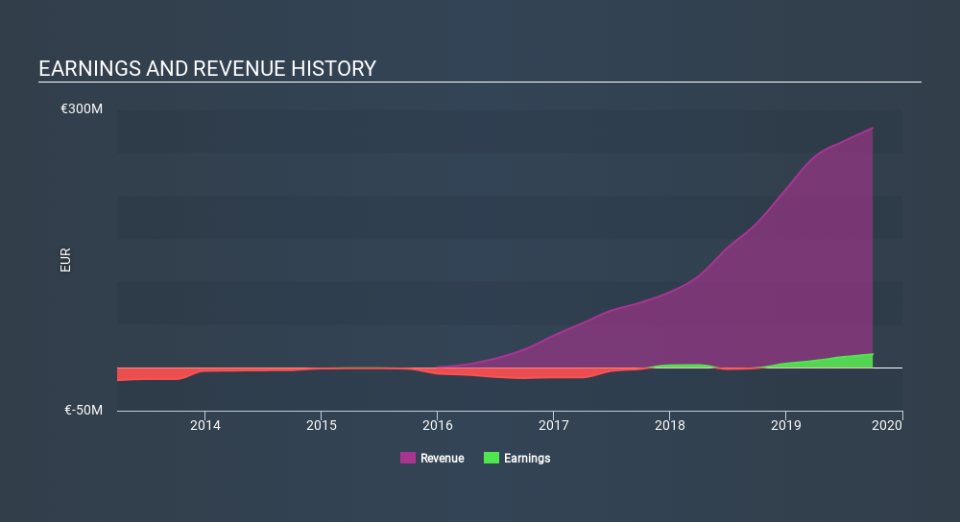
We note that, in three years, revenue has actually grown at a 67% annual rate, so that doesn't seem to be a reason to sell shares. This analysis is just perfunctory, but it might be worth researching Axactor more closely, as sometimes stocks fall unfairly. This could present an opportunity.
You can see below how earnings and revenue have changed over time (discover the exact values by clicking on the image).
We know that Axactor has improved its bottom line over the last three years, but what does the future have in store? You can see how its balance sheet has strengthened (or weakened) over time in this free interactive graphic.
What about the Total Shareholder Return (TSR)?
We'd be remiss not to mention the difference between Axactor's total shareholder return (TSR) and its share price return. Arguably the TSR is a more complete return calculation because it accounts for the value of dividends (as if they were reinvested), along with the hypothetical value of any discounted capital that have been offered to shareholders. We note that Axactor's TSR, at -40% is higher than its share price return of -40%. When you consider it hasn't been paying a dividend, this data suggests shareholders have benefitted from a spin-off, or had the opportunity to acquire attractively priced shares in a discounted capital raising.
A Different Perspective
Investors in Axactor had a tough year, with a total loss of 25%, against a market gain of about 7.2%. However, keep in mind that even the best stocks will sometimes underperform the market over a twelve month period. Longer term investors wouldn't be so upset, since they would have made 10%, each year, over five years. If the fundamental data continues to indicate long term sustainable growth, the current sell-off could be an opportunity worth considering. While it is well worth considering the different impacts that market conditions can have on the share price, there are other factors that are even more important. Be aware that Axactor is showing 1 warning sign in our investment analysis , you should know about...
We will like Axactor better if we see some big insider buys. While we wait, check out this free list of growing companies with considerable, recent, insider buying.
Please note, the market returns quoted in this article reflect the market weighted average returns of stocks that currently trade on NO exchanges.
If you spot an error that warrants correction, please contact the editor at editorial-team@simplywallst.com. This article by Simply Wall St is general in nature. It does not constitute a recommendation to buy or sell any stock, and does not take account of your objectives, or your financial situation. Simply Wall St has no position in the stocks mentioned.
We aim to bring you long-term focused research analysis driven by fundamental data. Note that our analysis may not factor in the latest price-sensitive company announcements or qualitative material. Thank you for reading.
