How the Broadcast Networks Stack Up – According to Ratings | Charts
As the big broadcast networks start to air their summer slate, it’s worth taking a look back on this last year of television. Every network likes to manipulate the math so they can claim they’re the best, especially during upfronts week. But what happens when you level the playing field?
Using the end-of-season ratings for each eligible show, TheWrap determined which network truly won primetime during the 2022-2023 season. A couple of notes on methodology: These numbers only took into account live-plus-same day viewing numbers for series that aired between 8 p.m. and 11 p.m. and don’t include ratings from sporting events or local programming. They also only look at a very limited timeframe, beginning with the first network premiere of the season (Fox’s “Monarch,” which debuted on Sept. 11) and ending with the last episode of a major primetime show (ABC’s “The Game Show Show,” which ended on May 30.)
With those guidelines in mind, we then looked at two major parameters to determine which network was most watched. The first and most weighted was which network had the highest-rated shows. To determine that we made a list of the top 20 primetime shows with the highest ratings in the key broadcast demographic or adults ages 18-49 years old, for scripted, unscripted and news programs (such as “60 Minutes,” “20/20” and “Dateline”). On this list, as is the case with every metric in this article, demo ratings were more heavily weighted than total viewers.
Highest-rated shows of the 2022-2023 season
RANK | SHOW | NETWORK | 18-49 RATINGS | TOTAL VIEWERS* |
1. | “60 Minutes” | CBS | 0.83 | 8.25 |
2. | “The Masked Singer” (Fall) | Fox | 0.72 | 3.95 |
3. | “Survivor” (Fall) | CBS | 0.71 | 4.99 |
4. | “Survivor” (Spring) | CBS | 0.71 | 5.00 |
5. | “American Idol” (Sunday) | ABC | 0.69 | 5.35 |
6. | Fox | 0.69 | 4.82 | |
7. | “Next Level Chef” | Fox | 0.69 | 2.80 |
8. | “The Voice” (Fall, Monday) | NBC | 0.67 | 6.19 |
9. | “The Voice” (Fall Tuesday) | NBC | 0.63 | 6.19 |
10. | “Chicago Fire” | NBC | 0.61 | 6.71 |
11. | “Young Sheldon” | CBS | 0.58 | 7.15 |
12. | “The Bachelor” | ABC | 0.58 | 2.99 |
13. | “Chicago Med” | NBC | 0.57 | 6.44 |
14. | “Ghosts” | CBS | 0.56 | 6.52 |
15. | “Bachelor in Paradise” (Tues) | ABC | 0.56 | 2.37 |
16. | “The Masked Singer” (Spring) | Fox | 0.56 | 3.70 |
17. | “The Simpsons” | Fox | 0.56 | 1.83 |
18. | “The Voice” (Spring, Mon) | NBC | 0.55 | 5.80 |
19. | “Jeopardy! Masters” | ABC | 0.55 | 5.72 |
20. | “Chicago PD” | NBC | 0.55 | 5.27 |
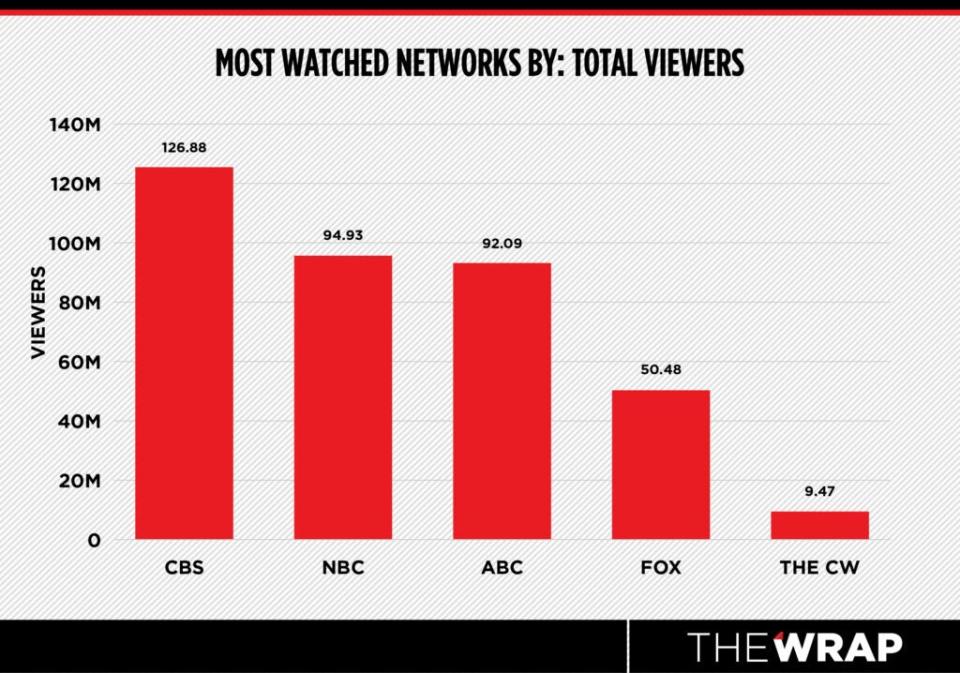
That was followed by total viewers. In order to determine this metric, we took the average live-plus-same day viewers of each eligible primetime show during the applicable seasons and added them together. All of these numbers are in millions:
So who really won the season? And who’s just treading water? We have some thoughts.

1. NBC: King of the highest-rated shows
For decades, there was really only one way to tell if a network show was successful or not: its rating in the key demographic. Most ad rates for entertainment programming are set around adults aged 18 to 49, a range where consumers are likely to have disposable income without having intense brand loyalty. And based on this all-important metric, no network had the most shows in the top 20 than NBC.
With six shows, NBC is the clear winner based on the metrics we’re counting. When it comes to the National Broadcasting Company, slow and steady is the name of the game. The network only has one show that appears in the Top 10 section of the list — “The Voice,” which earned a 0.67 rating for its Monday night time slot and a 0.63 rating for its Tuesday night time slot, both of which premiered in the fall. Those are relatively low numbers compared to juggernauts on this list like CBS’ “60 Minutes” (0.83) and Fox’s “The Masked Singer” (0.72). But what NBC lacks in big-name heavy hitters it makes up for in consistency.
Three of NBC’s four “Chicago” shows crack the top 20. The first is “Chicago Fire” at a 0.61, followed by “Chicago Med” at 0.57 and finally “Chicago PD” at 0.55. The last NBC show to appear on the list is — once again — the spring Monday night airings of “The Voice.” The singing competition series took the eighth, ninth and 18th spots on the list.
Though the network was the clear winner in our top category, it also performed well when it came to total viewers. CBS was the overall winner of this metric with an estimated 126.88 million total viewers during the 2022-2023 season. NBC came in second place with 94.93 million total viewers.
NBC’s Most Watched Series
Rank | Show Name | Average 18-49 Rating | Average Total Viewers |
1. | “The Voice” (Fall, Monday) | 0.67 | 6.19 |
2. | “The Voice” (Fall, Tuesday) | 0.63 | 6.20 |
3. | “Chicago Fire” | 0.61 | 0.671 |
4. | “Chicago Med” | 0.57 | 6.44 |
5. | “The Voice” (Spring, Monday) | 0.55 | 5.80 |
6. | “Chicago PD” | 0.55 | 5.27 |
7. | “Law and Order: SVU” | 0.55 | 4.71 |
8. | “America’s Got Talent: All-Stars” | 0.53 | 4.98 |
9. | “Night Court” | 0.52 | 4.06 |
10. | “The Voice” (Spring, Tuesday) | 0.48 | 5.19 |

2. CBS: King of Total Viewers
Let’s take advertisers out of the equation. If you’re looking for the network that has the most viewers period, that’s CBS.
By our calculations, CBS saw an average of 126.88 million total viewers during the 2022-2023 season, making it the only network to crack 100 million. It was then followed by NBC (94.93 million), ABC (92.09 million), Fox (50.48 million) and finally The CW (9.47 million).
Those are high numbers, but there’s another reason why CBS earns the second spot on our list. CBS came in second place in the 18-49 demo with five of its shows making the top 20 list. The network even scored the No. 1 spot thanks to “60 Minutes” (0.83).
That was then followed by two seasons of “Survivor” in the fall and spring, both of which earned a 0.71 rating in the demo. “Young Sheldon” was the next CBS show on the list with a 0.58 rating. Finally, two-season comedy “Ghosts” brought up the rear with a 0.56.
Overall, this is in line with how CBS presented itself during the television upfronts in May. The network claimed it was the overall most-watched, completing the 2022-2023 season with an average of 5.97 million viewers per episode. Considering that CBS’ viewers tend to skew older and therefore fall outside of the 18-49 range, these numbers make sense.
CBS’ Most Watched Series
Rank | Show Name | Average 18-49 Rating | Average Total Viewers |
1. | “60 Minutes” | 0.83 | 8.25 |
2. | “Survivor” (Fall) | 0.71 | 4.99 |
3. | “Survivor” (Spring) | 0.71 | 5.00 |
4. | “Young Sheldon” | 0.58 | 7.15 |
5. | “Ghosts” | 0.56 | 6.52 |
6. | “The Neighborhood” | 0.52 | 5.40 |
7. | “FBI” | 0.51 | 7.03 |
8. | “The Equalizer” | 0.5 | 6.49 |
9. | “Fire Country” | 0.5 | 5.93 |
10. | “NCIS” | 0.44 | 6.77 |

3. Fox: A Solid Contender
CBS may have had five shows on the top 20 list, but do you know who else did? Fox.
Much like the networks before, there were repeats on Fox’s list, but not nearly as many as appeared on NBC’s. The fall version of “The Masked Singer” was the network’s most-watched show, bringing in a ratings average of 0.72 in the demo and earning the No. 2 spot on the overall list. The spring version of “The Masked Singer” also appeared on the list in 16th place.
The three other series that cracked the top 20 were “9-1-1” (0.69), “Next Level Chef” (0.69) and “The Simpsons” (0.56). “9-1-1’s” high ranking is especially interesting considering the future of this series. Despite being highly rated and a network staple, “9-1-1” was axed by Fox in early May before ABC swept in and saved the disaster drama from Ryan Murphy, Brad Falchuk and Tim Minear.
Though Fox performed well in the top 20 shows list, the same can’t be said when it comes to total viewers. Based on that metric, the network ranked second to last, securing an averaged total of 50.48 million viewers. This is far below CBS (126.88 million), NBC (94.93 million) and ABC (92.09 million), but it is still well above The CW (9.47 million).
During the upfronts, Fox announced it “won” the 2022-2023 season due to its ratings in the 18-49 demographic. But because Fox used live-plus-seven day figures and we used live-plus-same day numbers, the results differ.
Fox’s Most Watched Series*
Rank | Show Name | Average 18-49 Rating | Average Total Viewers |
1. | “The Masked Singer” (Fall) | 0.72 | 3.95 |
2. | 0.69 | 4.82 | |
3. | “Next Level Chef” | 0.69 | 2.80 |
4. | “The Masked Singer” (Spring) | 0.56 | 3.70 |
5. | “The Simpsons” | 0.56 | 1.83 |
6. | “9-1-1: Lone Star” | 0.45 | 3.61 |
7. | “Hell’s Kitchen” | 0.4 | 2.07 |
8. | “Accused” | 0.38 | 2.38 |
9. | “LEGO Masters” | 0.36 | 1.53 |
10. | “Family Guy” | 0.36 | 1.14 |

4. ABC: Back of the pack
Only four ABC shows made their way onto the top 20 list, and they’re probably exactly the ones you’re imagining. The Sunday night airing of “American Idol” topped the network’s chart with a 0.69 in the demo. That came in at fifth place on the top 20 list.
“American Idol” was then followed by “The Bachelor” (0.58), the Tuesday night showing of “Bachelor in Paradise” (0.56) and “Jeopardy! Masters” (0.55). The remainder of ABC’s most-watched shows brought in similar ratings with the lowest (“Station 19”) coming in with a 0.47 in the demo.
Speaking of the demo, if it was valued lower than total viewers, we’d be looking at a very different lineup. Though ABC comes in 4th place when it comes to most-watched shows during the 2022-2023 season, it comes in 3rd place for total viewers. After CBS (126.88 million) and NBC (94.93 million), ABC appears on the total viewers ranking at a solid 92.09 million. But there is one network that performed worse than ABC when it comes to most-watched series and Fox when it comes to total viewers.
ABC’s Most Watched Series*
Rank | Show Name | Average 18-49 Rating | Average Total Viewers |
1. | “American Idol” (Sunday) | 0.69 | 5.35 |
2. | “The Bachelor” | 0.58 | 2.99 |
3. | “Bachelor in Paradise” (Tuesday) | 0.56 | 2.37 |
4. | “Jeopardy! Masters” | 0.55 | 5.72 |
5. | “American Idol” (Monday) | 0.52 | 4.38 |
6. | “Bachelor in Paradise” (Monday) | 0.52 | 2.27 |
7. | “The Conners” | 0.5 | 3.76 |
8. | “Abbott Elementary” | 0.5 | 2.76 |
9. | “America’s Funniest Home Videos” | 0.48 | 4.31 |
10. | “Station 19” | 0.47 | 3.86 |

5. The CW: Dead Last
It’s not surprising that The CW came in last place. After all the network, which was recently acquired by Nexstar Media Group, is in the middle of a massive programming overhaul as new ownership aims to make the network more profitable.
When it came to the most watched list, no CW shows appeared on the list. In fact, every single one of the over 100 primetime shows that premiered last year on one of the four networks performed better than The CW’s top-rated show. The only two that came close to “All American’s” 0.14 were Fox’s “Housebroken” (0.15) and NBC’s “The Blacklist” and “Grand Crew” (both at 0.18).
The CW didn’t fair much better when it came to total viewers. Compared to leader CBS’ 126.88 million viewers, The CW only brought in a total average of 9.47 million.
It isn’t as easy to compare The CW to the rest of its peers, however. Whereas the big four networks have clear primetime schedules, The CW relies more heavily on local programming. The network has also been in a noticeable state of flux. Instead of relying on new and returning scripted series, last year the network leaned heavily on “Whose Line Is It Anyway?” and “Penn and Teller: Fool Us” to fill in its programming gaps. Considering the many acquisitions the network has made in recent months, that may be a thing of the past. But for now, The CW is at the bottom of the barrel. Better luck in summer.
The CW’s Most Watched Series*
Rank | Show Name | Average 18-49 Rating | Average Total Viewers |
1. | “All American” | 0.14 | 0.48 |
2. | “Superman and Louis” | 0.11 | 0.65 |
3. | “All American: Homecoming” | 0.11 | 0.37 |
4. | “Walker” | 0.09 | 0.69 |
5. | “The Flash” | 0.09 | 0.50 |
6. | “Whose Line Is It Anyway?” (Season 19) | 0.08 | 0.52 |
7. | “Gotham Knights” | 0.08 | 0.42 |
8. | “Penn and Teller: Fool Us” | 0.07 | 0.67 |
9. | “Whose Line Is It Anyway?” (Season 20) | 0.07 | 0.47 |
10. | “The Winchesters” | 0.07 | 0.46 |
*based on 18-49 ratings
Also Read:
10 Takeaways from the 2023-2024 Upfronts: Few Celebs, Lots of Questions

