Bitcoin's Weekly Chart Shows Bear Market Likely to Worsen, or Does It?
There may be more pain ahead for bitcoin (BTC). That is the message from a weekly chart momentum indicator, which is about to flash the first bearish signal in over three years.
Bitcoin's 50-week simple moving average (SMA) is trending south and looks set to drop below the 100-week SMA in a week or two, confirming the so-called bearish crossover, the first since February 2019.
While in theory the upcoming bearish cross would imply strengthening of bearish momentum, the indicator has a perfect record of trapping sellers on the wrong side of the market, similar to the negative SMA crossover confirmed on the three-day chart last month.
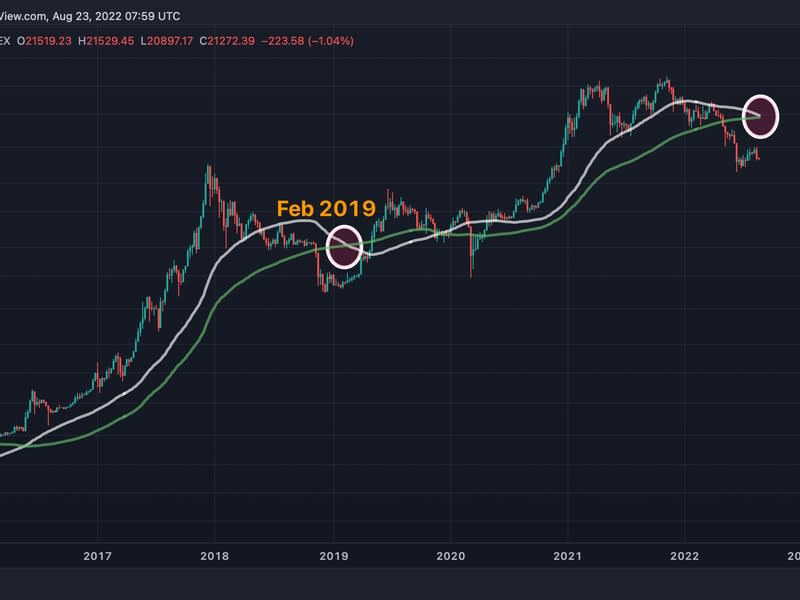
Bearish crossovers dated April 2015 and February 2019 proved to be contrary indicators – those that tell you to bet against the herd.
It remains to be seen if upcoming crossover marks peak selling. Per Delphi Digital, the cryptocurrency could bottom out in November.
"From the previous two cycles, BTC bottomed out 59 and 53 weeks following its cycle top. Based on this, history suggests a bottom sometime around the end of November 2022 and a new cycle top in August 2025," Delphi Digital's Andrew Krohn wrote in a daily update sent to clients.
Past performance is no guarantee of future results, more so, as the cryptocurrency has become sensitive to macro factors like central bank policies and traditional market sentiment over the past two years.
