Bitcoin and ETH Price Prediction: Support Intact, Why MATIC Rally Could Fade
Key Insights:
Bitcoin jumped to $20,450 before correcting lower.
Ether (ETH) is trading above the $1,085 and $1,070 support levels.
MATIC surged over 10% but faces a major hurdle near $0.55.
Bitcoin
In the past few sessions, bitcoin price found support and climbed above the $19,750 resistance. It even broke the $20,000 resistance and the 21 simple moving average (H1).
However, the bears defended the $20,450 zone. Recently, there was a downside correction below the $20,000 level and the 21 simple moving average (H1). The price is now trading near the $19,350 support and a connecting bullish trend line on the hourly chart.
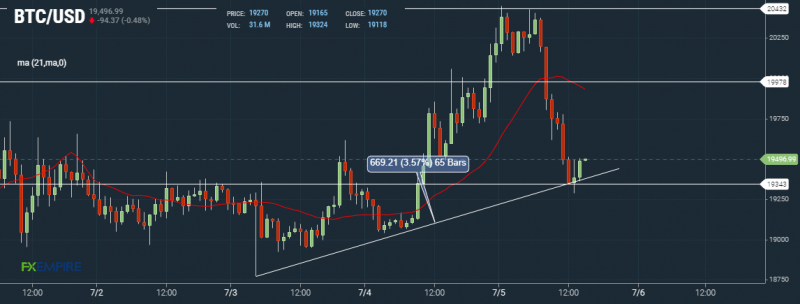
If bitcoin price stays above $19,350, it could rise towards $19,750. The first major resistance is near the $20,000 level. The main resistance sits at $20,450, above which the price could start a steady increase.
Ethereum (ETH)
ETH also followed a similar pattern after it formed a base above the $1,050 level. There was a decent increase above the $1,085 resistance and the 21 simple moving average (H1).
There was a clear move above the $1,130 resistance level before the bears appeared near $1,170. Recently, ether price corrected lower and traded below the $1,130 level. The bulls are now protecting the $1,085 support zone.
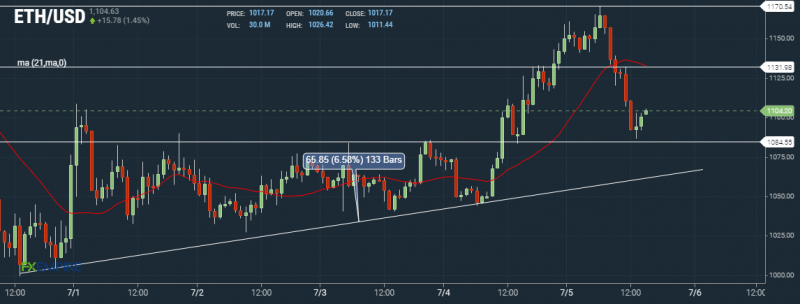
If there are more downsides, it could find support near $1,070. On the upside, the price might struggle near $1,135. The next major resistance is near the $1,170 level, above which the price could rise towards the $1,250 level.
Polygon (MATIC)
MATIC found support near the $0.3200 level after a massive drop from well above the $1.10 and $1.00 support levels.
The price settled below the $0.50 level and the 21-day simple moving average. Recently, there was a recovery wave above the $0.420 and $0.450 resistance levels. It even broke the $0.50 resistance and the 21-day simple moving average.
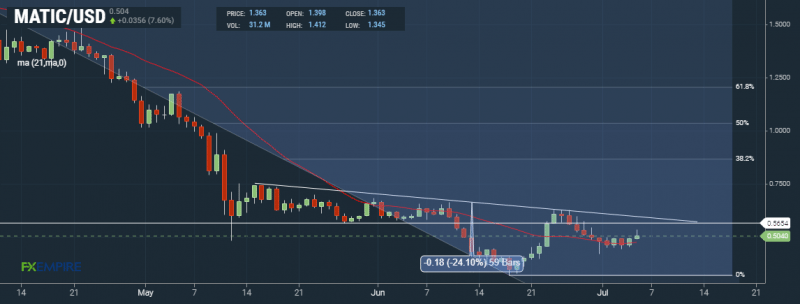
However, the price is facing a major hurdle near the $0.54 and $0.55 levels. There is also a key bearish trend line with resistance near $0.55 on the daily chart.
A close above the $0.54 and $0.55 levels may perhaps send MATIC price towards the $0.70 resistance zone or even $0.75. If not, there is a risk of a fresh decline below the $0.45 level.
ADA, BNB, and DOT price
Cardano (ADA) is struggling to gain pace above the $0.455 level. It is slowly moving lower towards the $0.432 support zone.
Binance Coin (BNB) struggled near the $235 level and is correcting gains. The main support on the downside is near $220.
Polkadot (DOT) failed to stay above the $7.0 pivot level. The price is now trading near $6.75, with a major support at $6.62.
A few trending altcoins are APE, BAT, and CRV. Out of these, CRV is gaining pace above the $0.88 resistance zone.
This article was originally posted on FX Empire
More From FXEMPIRE:
Russia pounds Ukraine’s Donetsk region after seizing Luhansk
U.S. says Iran’s repeated new demands in nuclear talks suggest lack of seriousness
Mexico’s Femsa seeks Swiss chain Valora as part of European push
Canada swiftly ratifies protocol for Finland, Sweden to join NATO
Omicron sub-variants BA.4, BA.5 make up 70% of COVID variants in U.S. – CDC
Norway oil and gas workers end strike as government steps in
