10 Best (and Worst) Places To Retire If You Have No Savings

When it comes to saving for retirement, Americans are finding out more and more that they have a lot of catching up to do. A GOBankingRates survey found that 40% of adults have less than $300 saved, which isn’t enough to live comfortably for even one year in retirement. Or is it?
See: Social Security: ‘Win-Win’ Bill To Cut Federal Taxes Would Extend Funds to 2054
Also: 6 Genius Things All Wealthy People Do With Their Money
If you have little to no savings and will likely have to rely on Social Security benefits, don’t assume that you won’t be able to have a comfortable retirement. There are places in the U.S. where you can get by without much in retirement savings.
To identify those places, GOBankingRates analyzed the 100 largest cities in the U.S. with a large population of adults ages 65 and older. These cities were then ranked based on the following factors:
Average 2023 home value and property tax, sourced from Zillow
Whether the state taxes Social Security benefits, sourced from the AARP
Annual homemaker services costs
Annual home health aide costs
Annual grocery costs
Annual healthcare costs
Annual utilities cost
Annual transportation costs
Annual necessity costs
From that list we pulled the 10 best places to retire and the 10 worst places to retire. On the whole, the best places to retire with no savings tend to be more affordable and relatively safe, and they have larger populations of older adults. The worst places for retirement tend to have a more expensive cost of living or other strikes against them, such as high crime rates.

10 Best Places To Retire With No Savings
Affordability is the key reason that these cities are the top 10 places to retire if you have no savings. Almost all have an average home price under $200,000. Plus, retirees can hang on to more of their income in these places because, with the exception of two cities in West Virginia and one in New Mexico, Social Security income isn’t taxed.
Learn: How Rare Coins Can Fund Your Early Retirement Dreams
More: 10 Ways for Retirees To Cut Back on Expenses in 2024
Sponsored: $20k or more in credit card debt? Lower the amount you owe in just 3 simple steps.

10. Punta Gorda, Florida
Percentage of population 65 and older: 50.4%
Average 2023 home value: $432,973
Average 2023 property tax: 0.91%
Whether the state taxes Social Security benefits: No
Annual homemaker services costs: $57,200
Annual home health aide costs: $57,200
Annual grocery costs: $4,861.26
Annual healthcare costs: $6,727.71
Annual utilities cost: $3,811.21
Annual transportation costs: $3,368.56
Annual necessity costs: $18,768.74
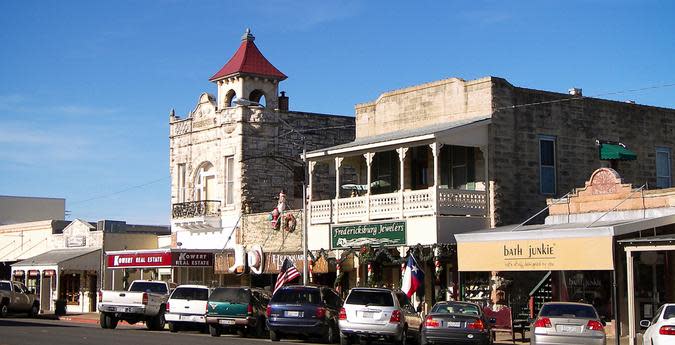
9. Fredericksburg, Texas
Percentage of population 65 and older: 31.7%
Average 2023 home value: $538,817
Average 2023 property tax: 1.66%
Whether the state taxes Social Security benefits: No
Annual homemaker services costs: $54,912
Annual home health aide costs: $54,912
Annual grocery costs: $4,303.63
Annual healthcare costs: $7,191.69
Annual utilities cost: $3,987.66
Annual transportation costs: $2,593.10
Annual necessity costs: $18,076.07

8. North Myrtle Beach, South Carolina
Percentage of population 65 and older: 37.6%
Average 2023 home value: $493,070
Average 2023 property tax: 0.56%
Whether the state taxes Social Security benefits: No
Annual homemaker services costs: $53,196
Annual home health aide costs: $53,768
Annual grocery costs: $4,550.96
Annual healthcare costs: $6,889.40
Annual utilities cost: $3,795.53
Annual transportation costs: $3,549.10
Annual necessity costs: $18,784.99
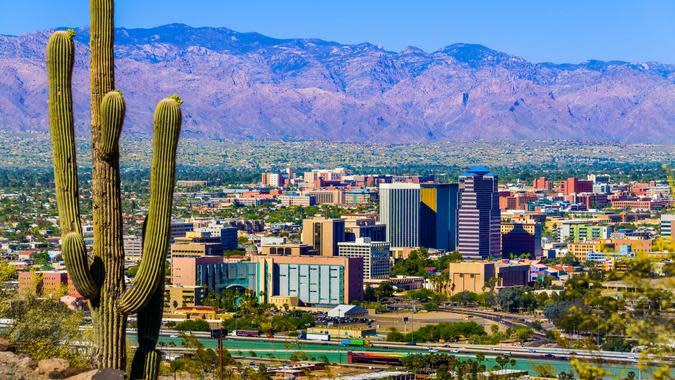
7. Green Valley, Arizona
Percentage of population 65 and older: 80%
Average 2023 home value: $315,908
Average 2023 property tax: 0.65%
Whether the state taxes Social Security benefits: No
Annual homemaker services costs: $64,064
Annual home health aide costs: $65,208
Annual grocery costs: $4,317.12
Annual healthcare costs: $6,003.62
Annual utilities cost: $4,011.18
Annual transportation costs: $3,746.04
Annual necessity costs: $18,077.96

6. Pinehurst, North Carolina
Percentage of population 65 and older: 39.5%
Average 2023 home value: $499,175
Average 2023 property tax: 0.82%
Whether the state taxes Social Security benefits: No
Annual homemaker services costs: $52,624
Annual home health aide costs: $52,624
Annual grocery costs: $4,537.47
Annual healthcare costs: $7,564.28
Annual utilities cost: $3,811.21
Annual transportation costs: $2,835.17
Annual necessity costs: $18,748.14
*Pictured Greensboro, North Carolina.

5. Bella Vista, Arkansas
Percentage of population 65 and older: 31.7%
Average 2023 home value: $322,770
Average 2023 property tax: 0.64%
Whether the state taxes Social Security benefits: No
Annual homemaker services costs: $50,222
Annual home health aide costs: $50,336
Annual grocery costs: $4,384.58
Annual healthcare costs: $6,460.57
Annual utilities cost: $3,713.19
Annual transportation costs: $4,000.43
Annual necessity costs: $18,558.76

4. The Villages, Florida
Percentage of population 65 and older: 85.7%
Average 2023 home value: $418,926
Average 2023 property tax: 0.91%
Whether the state taxes Social Security benefits: No
Annual homemaker services costs: $57,200
Annual home health aide costs: $57,200
Annual grocery costs: $4,591.44
Annual healthcare costs: $6,882.37
Annual utilities cost: $4,124.89
Annual transportation costs: $3,454.73
Annual necessity costs: $19,053.43
Learn: How To Invest In Gold
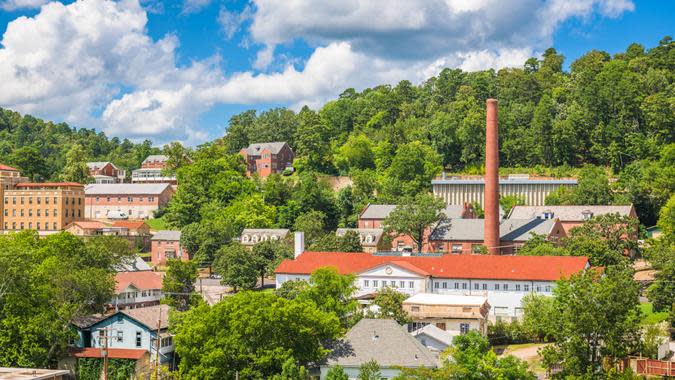
3. Hot Springs Village, Arkansas
Percentage of population 65 and older: 63.3%
Average 2023 home value: $289,418
Average 2023 property tax: 0.64%
Whether the state taxes Social Security benefits: No
Annual homemaker services costs: $50,222
Annual home health aide costs: $50,336
Annual grocery costs: $4,407.06
Annual healthcare costs: $6,748.80
Annual utilities cost: $3,744.56
Annual transportation costs: $3,787.07
Annual necessity costs: $18,687.48

2. Mountain Home, Arkansas
Percentage of population 65 and older: 28.3%
Average 2023 home value: $199,388
Average 2023 property tax: 0.64%
Whether the state taxes Social Security benefits: No
Annual homemaker services costs: $50,222
Annual home health aide costs: $50,336
Annual grocery costs: $4,276.65
Annual healthcare costs: $6,481.66
Annual utilities cost: $3,791.61
Annual transportation costs: $2,699.77
Annual necessity costs: $17,249.69

1. Foley, Alabama
Percentage of population 65 and older: 30.7%
Average 2023 home value: $296,232
Average 2023 property tax: 0.39%
Whether the state taxes Social Security benefits: No
Annual homemaker services costs: $45,760
Annual home health aide costs: $46,218
Annual grocery costs: $4,326.11
Annual healthcare costs: $8,119.65
Annual utilities cost: $3,858.26
Annual transportation costs: $2,884.41
Annual necessity costs: $19,188.44

10 Worst Places To Retire With No Savings
These 10 places are not such great cities to retire if you have no savings. Most of these cities have home prices that range from $450,000 on the low side to almost $4,000,000 on the high end. While many of these cities do not tax Social Security benefits, most of them do tax retirement income.
Additionally, the safety in these cities varies wildly, and the annual costs of services and expenditures remain on the high end.
Check Out: 10 Best Places in Colorado for a Couple To Live on Only a Social Security Check
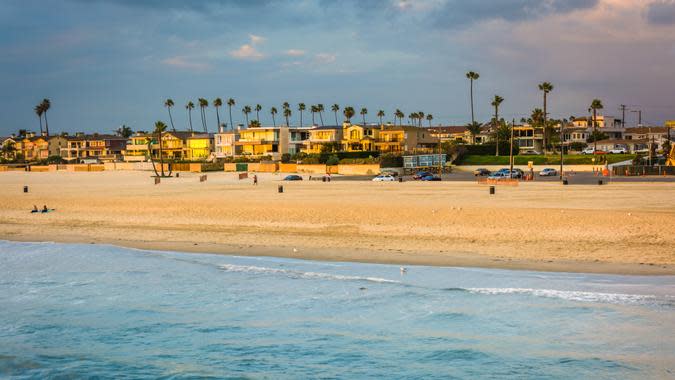
10. Seal Beach, California
Percentage of population 65 and older: 41.6%
Average 2023 home value: $1,449,290
Average 2023 property tax: 0.73%
Whether the state taxes Social Security benefits: No
Annual homemaker services costs: $73,216
Annual home health aide costs: $73,216
Annual grocery costs: $4,807.29
Annual healthcare costs: $6,566.02
Annual utilities cost: $3,826.90
Annual transportation costs: $4,989.25
Annual necessity costs: $20,189.46
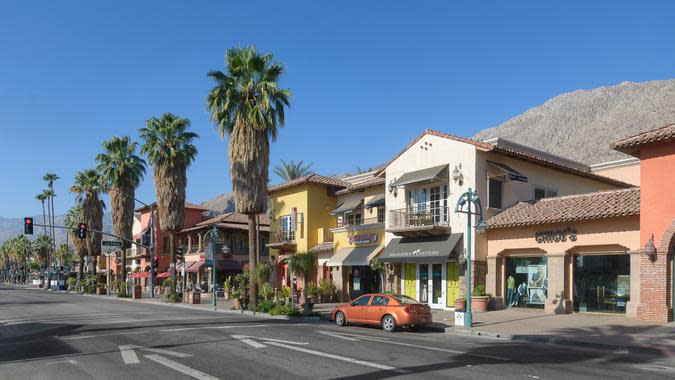
9. Palm Springs, California
Percentage of population 65 and older: 32.4%
Average 2023 home value: $1,055,350
Average 2023 property tax: 0.73%
Whether the state taxes Social Security benefits: No
Annual homemaker services costs: $73,216
Annual home health aide costs: $73,216
Annual grocery costs: $4,501.50
Annual healthcare costs: $6,137.19
Annual utilities cost: $4,466.02
Annual transportation costs: $5,338.00
Annual necessity costs: $20,442.71

8. Sonoma, California
Percentage of population 65 and older: 32.6%
Average 2023 home value: $1,017,937
Average 2023 property tax: 0.73%
Whether the state taxes Social Security benefits: No
Annual homemaker services costs: $73,216
Annual home health aide costs: $73,216
Annual grocery costs: $4,991.67
Annual healthcare costs: $7,831.42
Annual utilities cost: $4,058.24
Annual transportation costs: $4,455.86
Annual necessity costs: $21,337.18
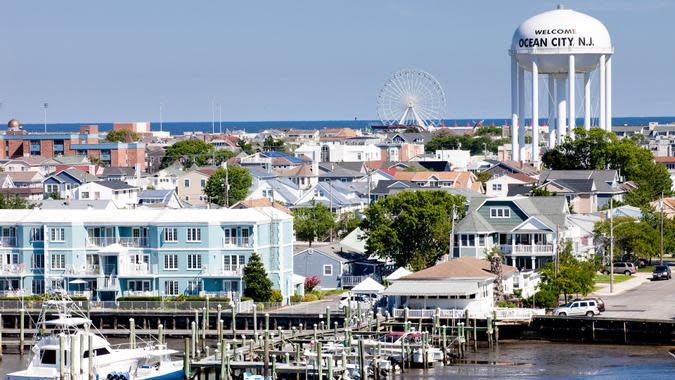
7. Ocean City, New Jersey
Percentage of population 65 and older: 34.2%
Average 2023 home value: $1,193,688
Average 2023 property tax: 2.21%
Whether the state taxes Social Security benefits: No
Annual homemaker services costs: $66,352
Annual home health aide costs: $68,526
Annual grocery costs: $5,135.57
Annual healthcare costs: $6,847.22
Annual utilities cost: $4,383.68
Annual transportation costs: $4,004.53
Annual necessity costs: $20,371.00
I’m a Financial Planning Expert: Here Are 5 Things You Should Never Spend Money on If You Want To Be Rich

6. Key Largo, Florida
Percentage of population 65 and older: 27.5%
Average 2023 home value: $1,014,239
Average 2023 property tax: 0.91%
Whether the state taxes Social Security benefits: No
Annual homemaker services costs: $57,200
Annual home health aide costs: $57,200
Annual grocery costs: $5,131.08
Annual healthcare costs: $11,416.72
Annual utilities cost: $3,811.21
Annual transportation costs: $3,733.73
Annual necessity costs: $24,092.74

5. Paradise Valley, Arizona
Percentage of population 65 and older: 30%
Average 2023 home value: $3,020,040
Average 2023 property tax: 0.65%
Whether the state taxes Social Security benefits: No
Annual homemaker services costs: $64,064
Annual home health aide costs: $65,208
Annual grocery costs: $5,135.57
Annual healthcare costs: $6,502.75
Annual utilities cost: $3,975.89
Annual transportation costs: $4,574.85
Annual necessity costs: $20,189.06

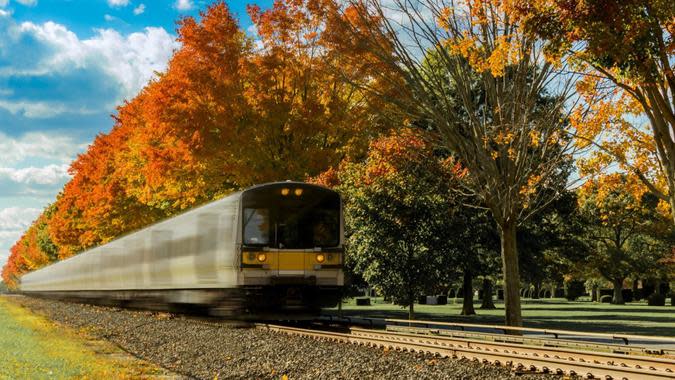
4. Ridge, New York
Percentage of population 65 and older: 30.3%
Average 2023 home value: $452,066
Average 2023 property tax: 1.38%
Whether the state taxes Social Security benefits: No
Annual homemaker services costs: $64,064
Annual home health aide costs: $66,352
Annual grocery costs: $4,694.87
Annual healthcare costs: $8,801.56
Annual utilities cost: $4,916.93
Annual transportation costs: $4,566.64
Annual necessity costs: $22,980.00
*Long Island, N.Y., pictured.
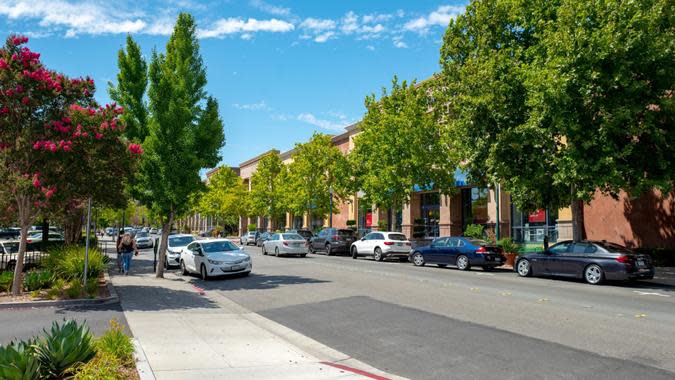
3. Melville, New York
Percentage of population 65 and older: 27.9%
Average 2023 home value: $767,494
Average 2023 property tax: 1.38%
Whether the state taxes Social Security benefits: No
Annual homemaker services costs: $64,064
Annual home health aide costs: $66,352
Annual grocery costs: $4,883.75
Annual healthcare costs: $8,801.56
Annual utilities cost: $4,916.93
Annual transportation costs: $4,640.49
Annual necessity costs: $23,242.73
I’m a Self-Made Millionaire: These Are the 6 Investments Everyone Should Make During an Economic Downturn
*Farmingdale, N.Y., pictured.
2. Walnut Creek, California
Percentage of population 65 and older: 29.6%
Average 2023 home value: $1,435,836
Average 2023 property tax: 0.73%
Whether the state taxes Social Security benefits: No
Annual homemaker services costs: $73,216
Annual home health aide costs: $73,216
Annual grocery costs: $5,036.64
Annual healthcare costs: $8,513.33
Annual utilities cost: $4,022.95
Annual transportation costs: $5,231.33
Annual necessity costs: $22,804.24
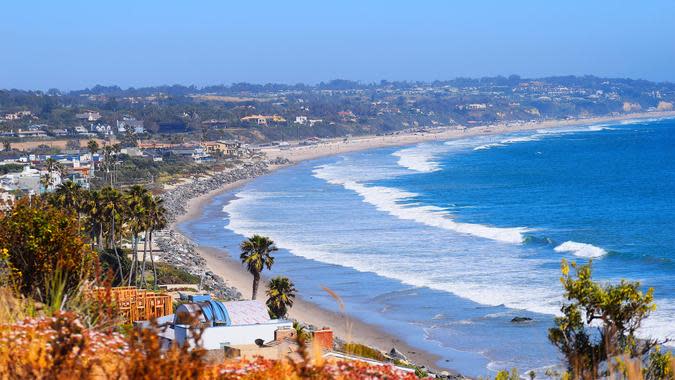
1. Malibu, California
Percentage of population 65 and older: 28.9%
Average 2023 home value: $3,835,224
Average 2023 property tax: 0.73%
Whether the state taxes Social Security benefits: No
Annual homemaker services costs: $73,216
Annual home health aide costs: $73,216
Annual grocery costs: $5,315.45
Annual healthcare costs: $6,341.06
Annual utilities cost: $4,015.10
Annual transportation costs: $6,868.42
Annual necessity costs: $22,540.04
Julian Barazza contributed to this article.
Methodology: For this piece, GOBankingRates first found the 100 towns or cities with the (1) highest percentage of its population aged 65 years and older, as sourced from the U.S. Census Bureau 2021 American Community Survey. GOBankingRates analyzed those 100 cities across the following factors: (2) property tax as sourced from Tax Foundation; (3) the average 2023 home value for a single-family residence as sourced from Zillow’s May 2023 data. GOBankingRates then took the Bureau of Labor Statistics Consumer Expenditure Survey’s 2021 annual expenditures for consumers 65 years and older for Groceries (“food at home”), Healthcare, Utilities (“utilities, fuels and public services”), and Transportation (gas, other fuels & motor oils” + ” other vehicle expenses”). These annual expenditures were then factored out for each city using Sperling’s Best Places Cost of Living Indices and combined to give a (4) total annual Cost of Living Expenditure for each city; (5) taxes on Social Security benefits; and (6) The annual cost of an adult day health care service on the state level, (7) the annual cost of homemaker services on the state level, and (8) the annual cost of a home health aide on the state level were all sourced from Genworth’s annual Cost of Care Survey. These eight factors were then compiled and scored, with a lower score being better. In final calculations annual expenditure scores were weighted 3x, home value scores were weighted 2x, and taxes on Social Security were weighted 0.5x. All research was conducted and up to date on June 14, 2023.
More From GOBankingRates
I Was Retired, but Wasted Big Money On These 3 Things and Had To Go Back To Work
7 Things to Do With Your Savings in 2024 to Grow Your Wealth
4 Reasons You Should Be Getting Your Paycheck Early, According to An Expert
This article originally appeared on GOBankingRates.com: 10 Best (and Worst) Places To Retire If You Have No Savings
