Is Yip's Chemical Holdings Limited's (HKG:408) High P/E Ratio A Problem For Investors?

Want to participate in a research study? Help shape the future of investing tools and earn a $60 gift card!
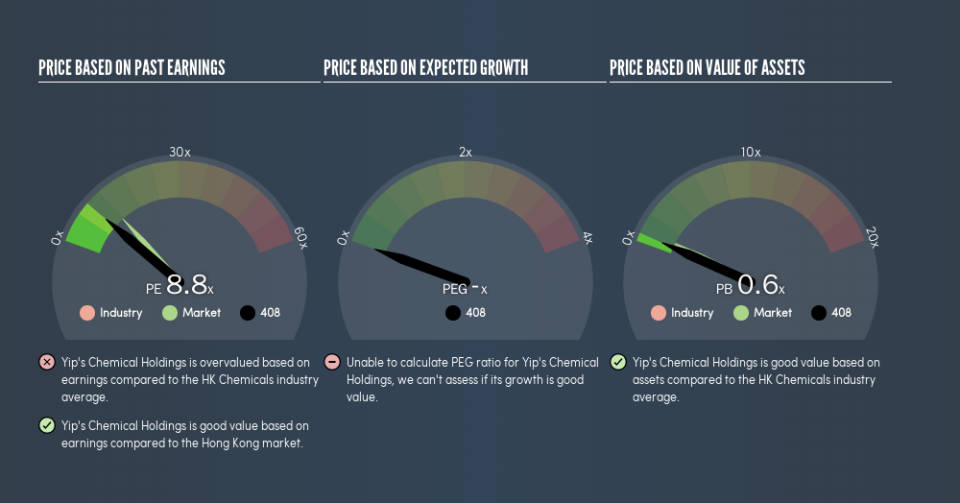
Today, we'll introduce the concept of the P/E ratio for those who are learning about investing. We'll look at Yip's Chemical Holdings Limited's (HKG:408) P/E ratio and reflect on what it tells us about the company's share price. Looking at earnings over the last twelve months, Yip's Chemical Holdings has a P/E ratio of 8.85. In other words, at today's prices, investors are paying HK$8.85 for every HK$1 in prior year profit.
See our latest analysis for Yip's Chemical Holdings
How Do I Calculate A Price To Earnings Ratio?
The formula for price to earnings is:
Price to Earnings Ratio = Share Price ÷ Earnings per Share (EPS)
Or for Yip's Chemical Holdings:
P/E of 8.85 = HK$2.9 ÷ HK$0.33 (Based on the year to December 2018.)
Is A High P/E Ratio Good?
The higher the P/E ratio, the higher the price tag of a business, relative to its trailing earnings. That isn't necessarily good or bad, but a high P/E implies relatively high expectations of what a company can achieve in the future.
How Growth Rates Impact P/E Ratios
P/E ratios primarily reflect market expectations around earnings growth rates. That's because companies that grow earnings per share quickly will rapidly increase the 'E' in the equation. That means even if the current P/E is high, it will reduce over time if the share price stays flat. And as that P/E ratio drops, the company will look cheap, unless its share price increases.
Yip's Chemical Holdings increased earnings per share by 8.3% last year. And earnings per share have improved by 57% annually, over the last three years. But earnings per share are down 6.0% per year over the last five years.
Does Yip's Chemical Holdings Have A Relatively High Or Low P/E For Its Industry?
One good way to get a quick read on what market participants expect of a company is to look at its P/E ratio. You can see in the image below that the average P/E (8.4) for companies in the chemicals industry is roughly the same as Yip's Chemical Holdings's P/E.
Its P/E ratio suggests that Yip's Chemical Holdings shareholders think that in the future it will perform about the same as other companies in its industry classification. So if Yip's Chemical Holdings actually outperforms its peers going forward, that should be a positive for the share price. Further research into factors such asmanagement tenure, could help you form your own view on whether that is likely.
A Limitation: P/E Ratios Ignore Debt and Cash In The Bank
The 'Price' in P/E reflects the market capitalization of the company. In other words, it does not consider any debt or cash that the company may have on the balance sheet. The exact same company would hypothetically deserve a higher P/E ratio if it had a strong balance sheet, than if it had a weak one with lots of debt, because a cashed up company can spend on growth.
While growth expenditure doesn't always pay off, the point is that it is a good option to have; but one that the P/E ratio ignores.
How Does Yip's Chemical Holdings's Debt Impact Its P/E Ratio?
Yip's Chemical Holdings's net debt is 84% of its market cap. If you want to compare its P/E ratio to other companies, you should absolutely keep in mind it has significant borrowings.
The Verdict On Yip's Chemical Holdings's P/E Ratio
Yip's Chemical Holdings's P/E is 8.8 which is below average (12.1) in the HK market. It's good to see EPS growth in the last 12 months, but the debt on the balance sheet might be muting expectations.
Investors have an opportunity when market expectations about a stock are wrong. As value investor Benjamin Graham famously said, 'In the short run, the market is a voting machine but in the long run, it is a weighing machine.' We don't have analyst forecasts, but shareholders might want to examine this detailed historical graph of earnings, revenue and cash flow.
You might be able to find a better buy than Yip's Chemical Holdings. If you want a selection of possible winners, check out this free list of interesting companies that trade on a P/E below 20 (but have proven they can grow earnings).
We aim to bring you long-term focused research analysis driven by fundamental data. Note that our analysis may not factor in the latest price-sensitive company announcements or qualitative material.
If you spot an error that warrants correction, please contact the editor at editorial-team@simplywallst.com. This article by Simply Wall St is general in nature. It does not constitute a recommendation to buy or sell any stock, and does not take account of your objectives, or your financial situation. Simply Wall St has no position in the stocks mentioned. Thank you for reading.
