WTI Crude Oil Daily Analysis – September 19, 2017
Oil prices edge higher on Tuesday, following the recovery after Hurricanes Harvey and Irma. The upside pressure is supported by a fall in Suadi Arabia crude exports.
The U.S raises their imports at reopened ports to cover the shortfall in production that caused by Hurricane Harvey, despite a recovery from the recent hurricanes.
In addition, The bullish reports from OPEC and IEA last week have boosted crude supplies.
The American Petroleum Institute (API) is due to release its weekly oil data later on today.
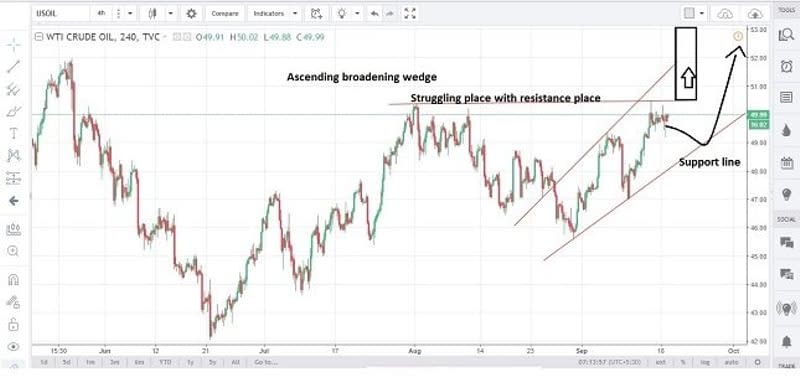
Technical View
The four-hour chart has formed “Ascending broadening wedge”. Currently, prices hold nearby the resistance area at $ 50.66 which indicates a positive momentum. If prices do not break the resistance line, it could lead towards the support line at $ 49.20.
On the second scenario, a break and the rally will continue to rise towards $50.50-52.
The crude oil market trend gives us the impression that the lower highs and lower lows are constantly repeated to create a Double top. A crossover above the crucial area at $50.60 could lead towards $52.50-55.

On the daily chart, the 50-day moving average crossed over the long-term 100-day moving average at $47.40, indicating a bullish momentum.
The crude oil daily chart has formed a “Symmetrical triangle pattern”. Prices have broken the resistance line at $49.50 and currently trade above $50.50. Prices hold above the 200-day Moving average line which is a positive indication towards $52-$55.
This article was originally posted on FX Empire

