Why Ur-Energy Inc.’s (TSE:URE) High P/E Ratio Isn’t Necessarily A Bad Thing

Want to participate in a short research study? Help shape the future of investing tools and receive a $20 prize!
The goal of this article is to teach you how to use price to earnings ratios (P/E ratios). We’ll show how you can use Ur-Energy Inc.’s (TSE:URE) P/E ratio to inform your assessment of the investment opportunity. Ur-Energy has a P/E ratio of 38.64, based on the last twelve months. That corresponds to an earnings yield of approximately 2.6%.
Check out our latest analysis for Ur-Energy
How Do I Calculate A Price To Earnings Ratio?
The formula for P/E is:
Price to Earnings Ratio = Share Price (in reporting currency) ÷ Earnings per Share (EPS)
Or for Ur-Energy:
P/E of 38.64 = $0.73 (Note: this is the share price in the reporting currency, namely, USD ) ÷ $0.019 (Based on the year to September 2018.)
Is A High Price-to-Earnings Ratio Good?
A higher P/E ratio implies that investors pay a higher price for the earning power of the business. That isn’t necessarily good or bad, but a high P/E implies relatively high expectations of what a company can achieve in the future.
How Growth Rates Impact P/E Ratios
Probably the most important factor in determining what P/E a company trades on is the earnings growth. Earnings growth means that in the future the ‘E’ will be higher. That means even if the current P/E is high, it will reduce over time if the share price stays flat. A lower P/E should indicate the stock is cheap relative to others — and that may attract buyers.
Ur-Energy shrunk earnings per share by 24% over the last year. But EPS is up 75% over the last 5 years.
How Does Ur-Energy’s P/E Ratio Compare To Its Peers?
The P/E ratio indicates whether the market has higher or lower expectations of a company. You can see in the image below that the average P/E (15.4) for companies in the oil and gas industry is lower than Ur-Energy’s P/E.
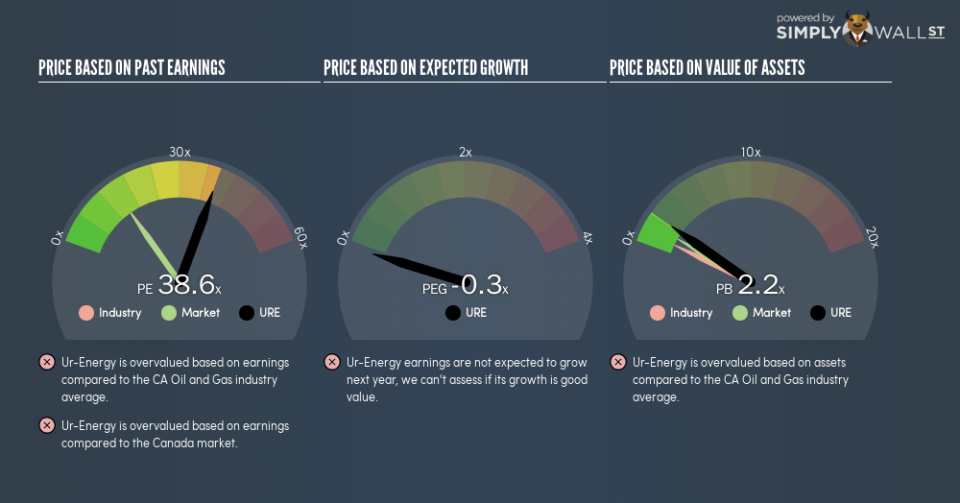
Its relatively high P/E ratio indicates that Ur-Energy shareholders think it will perform better than other companies in its industry classification. Shareholders are clearly optimistic, but the future is always uncertain. So further research is always essential. I often monitor director buying and selling.
Remember: P/E Ratios Don’t Consider The Balance Sheet
The ‘Price’ in P/E reflects the market capitalization of the company. In other words, it does not consider any debt or cash that the company may have on the balance sheet. Theoretically, a business can improve its earnings (and produce a lower P/E in the future), by taking on debt (or spending its remaining cash).
Such spending might be good or bad, overall, but the key point here is that you need to look at debt to understand the P/E ratio in context.
Is Debt Impacting Ur-Energy’s P/E?
Net debt totals just 3.7% of Ur-Energy’s market cap. The market might award it a higher P/E ratio if it had net cash, but its unlikely this low level of net borrowing is having a big impact on the P/E multiple.
The Verdict On Ur-Energy’s P/E Ratio
Ur-Energy trades on a P/E ratio of 38.6, which is above the CA market average of 15. With a bit of debt, but a lack of recent growth, it’s safe to say the market is expecting improved profit performance from the company, in the next few years.
When the market is wrong about a stock, it gives savvy investors an opportunity. If the reality for a company is better than it expects, you can make money by buying and holding for the long term. So this free report on the analyst consensus forecasts could help you make a master move on this stock.
But note: Ur-Energy may not be the best stock to buy. So take a peek at this free list of interesting companies with strong recent earnings growth (and a P/E ratio below 20).
We aim to bring you long-term focused research analysis driven by fundamental data. Note that our analysis may not factor in the latest price-sensitive company announcements or qualitative material.
If you spot an error that warrants correction, please contact the editor at editorial-team@simplywallst.com. This article by Simply Wall St is general in nature. It does not constitute a recommendation to buy or sell any stock, and does not take account of your objectives, or your financial situation. Simply Wall St has no position in the stocks mentioned. On rare occasion, data errors may occur. Thank you for reading.
