Why Keyera Corp.'s (TSE:KEY) High P/E Ratio Isn't Necessarily A Bad Thing

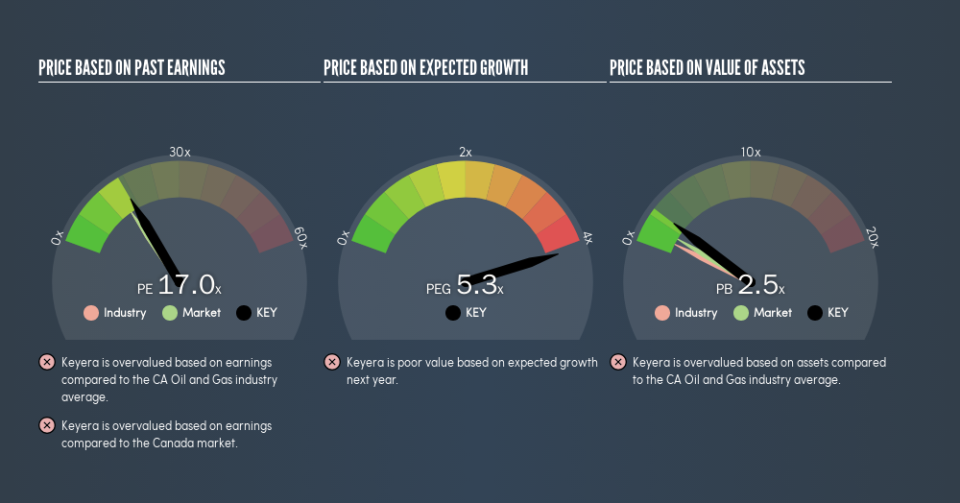
Today, we'll introduce the concept of the P/E ratio for those who are learning about investing. To keep it practical, we'll show how Keyera Corp.'s (TSE:KEY) P/E ratio could help you assess the value on offer. Based on the last twelve months, Keyera's P/E ratio is 16.99. In other words, at today's prices, investors are paying CA$16.99 for every CA$1 in prior year profit.
See our latest analysis for Keyera
How Do I Calculate A Price To Earnings Ratio?
The formula for P/E is:
Price to Earnings Ratio = Share Price ÷ Earnings per Share (EPS)
Or for Keyera:
P/E of 16.99 = CA$32.3 ÷ CA$1.9 (Based on the year to December 2018.)
Is A High Price-to-Earnings Ratio Good?
A higher P/E ratio means that investors are paying a higher price for each CA$1 of company earnings. That isn't necessarily good or bad, but a high P/E implies relatively high expectations of what a company can achieve in the future.
How Growth Rates Impact P/E Ratios
P/E ratios primarily reflect market expectations around earnings growth rates. That's because companies that grow earnings per share quickly will rapidly increase the 'E' in the equation. That means even if the current P/E is high, it will reduce over time if the share price stays flat. A lower P/E should indicate the stock is cheap relative to others -- and that may attract buyers.
It's great to see that Keyera grew EPS by 24% in the last year. And it has bolstered its earnings per share by 15% per year over the last five years. With that performance, you might expect an above average P/E ratio.
Does Keyera Have A Relatively High Or Low P/E For Its Industry?
One good way to get a quick read on what market participants expect of a company is to look at its P/E ratio. As you can see below, Keyera has a higher P/E than the average company (15.3) in the oil and gas industry.
That means that the market expects Keyera will outperform other companies in its industry. The market is optimistic about the future, but that doesn't guarantee future growth. So investors should always consider the P/E ratio alongside other factors, such as whether company directors have been buying shares.
Don't Forget: The P/E Does Not Account For Debt or Bank Deposits
It's important to note that the P/E ratio considers the market capitalization, not the enterprise value. In other words, it does not consider any debt or cash that the company may have on the balance sheet. The exact same company would hypothetically deserve a higher P/E ratio if it had a strong balance sheet, than if it had a weak one with lots of debt, because a cashed up company can spend on growth.
Such spending might be good or bad, overall, but the key point here is that you need to look at debt to understand the P/E ratio in context.
Is Debt Impacting Keyera's P/E?
Net debt is 34% of Keyera's market cap. While it's worth keeping this in mind, it isn't a worry.
The Verdict On Keyera's P/E Ratio
Keyera trades on a P/E ratio of 17, which is above the CA market average of 15.3. The company is not overly constrained by its modest debt levels, and its recent EPS growth very solid. So on this analysis it seems reasonable that its P/E ratio is above average.
Investors should be looking to buy stocks that the market is wrong about. As value investor Benjamin Graham famously said, 'In the short run, the market is a voting machine but in the long run, it is a weighing machine.' So this free visualization of the analyst consensus on future earnings could help you make the right decision about whether to buy, sell, or hold.
Of course you might be able to find a better stock than Keyera. So you may wish to see this free collection of other companies that have grown earnings strongly.
We aim to bring you long-term focused research analysis driven by fundamental data. Note that our analysis may not factor in the latest price-sensitive company announcements or qualitative material.
If you spot an error that warrants correction, please contact the editor at editorial-team@simplywallst.com. This article by Simply Wall St is general in nature. It does not constitute a recommendation to buy or sell any stock, and does not take account of your objectives, or your financial situation. Simply Wall St has no position in the stocks mentioned. Thank you for reading.

