Where SerVision PLC (LON:SEV) Stands In Terms Of Earnings Growth Against Its Industry

After looking at SerVision PLC’s (AIM:SEV) latest earnings announcement (30 June 2017), I found it useful to revisit the company’s performance in the past couple of years and assess this against the most recent figures. As a long-term investor I tend to focus on earnings trend, rather than a single number at one point in time. Also, comparing it against an industry benchmark to understand whether it outperformed, or is simply riding an industry wave, is a crucial aspect. Below is a brief commentary on my key takeaways. Check out our latest analysis for SerVision
How Well Did SEV Perform?
For the most up-to-date info, I use data from the most recent 12 months, which annualizes the latest 6-month earnings release, or some times, the latest annual report is already the most recent financial data. This blend enables me to assess many different companies in a uniform manner using the latest information. For SerVision, its most recent trailing-twelve-month earnings is -US$3.22M, which, in comparison to last year’s level, has become more negative. Given that these values may be somewhat nearsighted, I have created an annualized five-year value for SerVision’s net income, which stands at -US$1.49M. This doesn’t seem to paint a better picture, since earnings seem to have steadily been getting more and more negative over time.
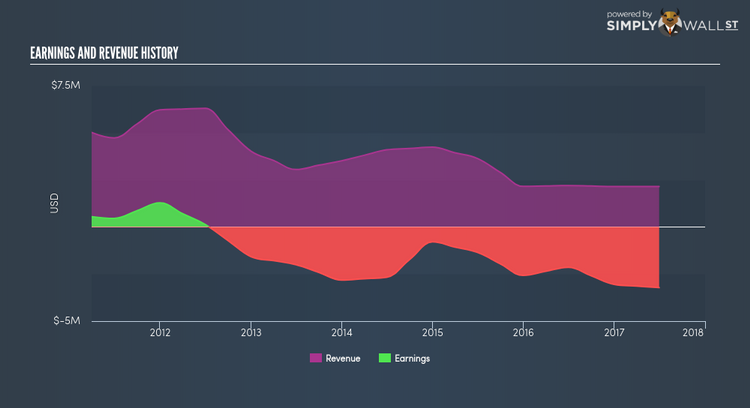
We can further assess SerVision’s loss by looking at what the industry has been experiencing over the past few years. Each year, for the past half a decade SerVision has seen an annual decline in revenue of -16.09%, on average. This adverse movement is a driver of the company’s inability to reach breakeven. Has the entire industry experienced this headwind? Inspecting growth from a sector-level, the UK electronic industry has been ramping up average earnings growth of 66.80% in the prior year, and a flatter 1.52% over the past half a decade. This shows that whatever tailwind the industry is deriving benefit from, SerVision has not been able to realize the gains unlike its industry peers.
What does this mean?
Though SerVision’s past data is helpful, it is only one aspect of my investment thesis. Companies that incur net loss is always hard to forecast what will happen in the future and when. The most valuable step is to examine company-specific issues SerVision may be facing and whether management guidance has regularly been met in the past. I recommend you continue to research SerVision to get a more holistic view of the stock by looking at:
1. Financial Health: Is SEV’s operations financially sustainable? Balance sheets can be hard to analyze, which is why we’ve done it for you. Check out our financial health checks here.
2. Other High-Performing Stocks: Are there other stocks that provide better prospects with proven track records? Explore our free list of these great stocks here.
NB: Figures in this article are calculated using data from the trailing twelve months from 30 June 2017. This may not be consistent with full year annual report figures.
To help readers see pass the short term volatility of the financial market, we aim to bring you a long-term focused research analysis purely driven by fundamental data. Note that our analysis does not factor in the latest price sensitive company announcements.
The author is an independent contributor and at the time of publication had no position in the stocks mentioned.
