USD/JPY Forex Technical Analysis – Daily Reversal Bottom Confirmed by Trade Through 107.735
The Dollar/Yen closed slightly higher on Friday, but only after the Forex pair hit its lowest level since January 3. The price action reflects position-squaring ahead of the week-end and a reaction to a recovery in U.S. Treasury yields.
The tone was bearish throughout the week, driven by a dovish U.S. Federal Reserve that opened the door to an interest rate cut later this year. Central bank policymakers did not say there would be a rate cut nor did they indicate a specific future date. However, another steep plunge in the benchmark 10-year U.S. Treasury yield indicates that investors are pricing in a 100% chance of a rate cut at the next Fed meeting on July 31.
On Friday, the USD/JPY settled at 107.310, up 0.005 or +0.00%.
Daily Swing Chart Technical Analysis
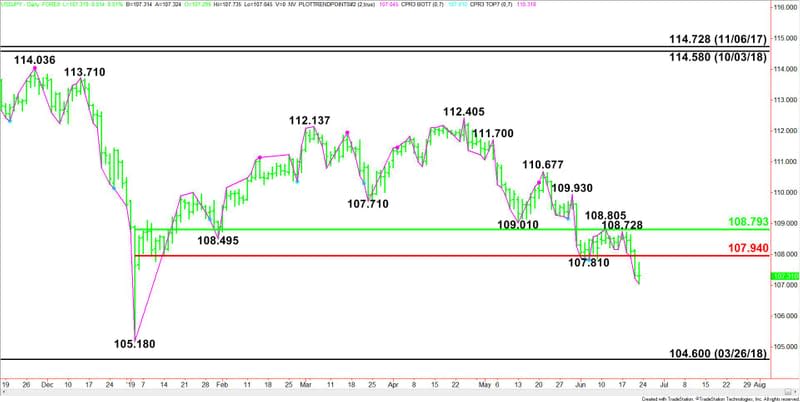
The main trend is down according to the daily swing chart. However, Friday’s closing price reversal bottom suggests the buying may be greater than the selling at current price levels. If confirmed, this could lead to a 2 to 3 day counter-trend rally. The main trend will change to up on a move through 108.728.
A trade through 107.045 will negate the closing price reversal bottom chart pattern and signal a resumption of the downtrend.
The main range is 105.180 to 112.405. Its retracement zone at 108.793 to 107.940 is controlling the near-term direction of the USD/JPY. Holding below this zone will help maintain the downside bias. This zone is near-term resistance.
Daily Swing Chart Technical Forecast
Based on Friday’s close at 107.310, the direction of the USD/JPY on Monday is likely to be determined by trader reaction to Friday’s close at 107.735.
Bullish Scenario
Taking out 107.735 will confirm the closing price reversal bottom. The first target is the main Fibonacci level at 107.940. This is followed by a short-term retracement zone at 107.887 to 108.085. Also inside the main retracement zone is a pair of tops at 108.728 to 108.805.
The USD/JPY needs to clear 108.793 to change the bearish sentiment to positive.
Bearish Scenario
The inability to confirm Friday’s closing price reversal bottom will signal the presence of sellers. Taking out 107.045 will negate the closing price reversal bottom and signal a resumption of the downtrend. The daily chart is wide open to the downside with the January 3 main bottom at 105.180 the next downside target. This is followed by the March 26, 2018 main bottom at 104.600.
This article was originally posted on FX Empire
More From FXEMPIRE:
US Stock Market Overview – Stocks Slip on Weak Manufacturing Data
S&P 500 Price Forecast – Stock markets continue to run into resistance
Crude Oil Price Forecast – Crude oil market struggle on Monday
Crude Oil Price Update – Strengthens Over $58.03, Weakens Under $57.29
AUD/USD Price Forecast – Australian dollar heading towards resistance
Natural Gas Price Forecast – Natural Gas markets rally to kick off week

