An Undervalued Bitcoin Attracts Money To The Entire Crypto Board
Unconfirmed upward breaks attract market attention.
Ethereum enjoys market support thanks to Constantinople.
XRP sows doubt in its already classic anti-cyclical market behavior.
Friday finally arrives after a boring week on the crypto-board that looks like it's going to give us some activity and get us out of boredom.
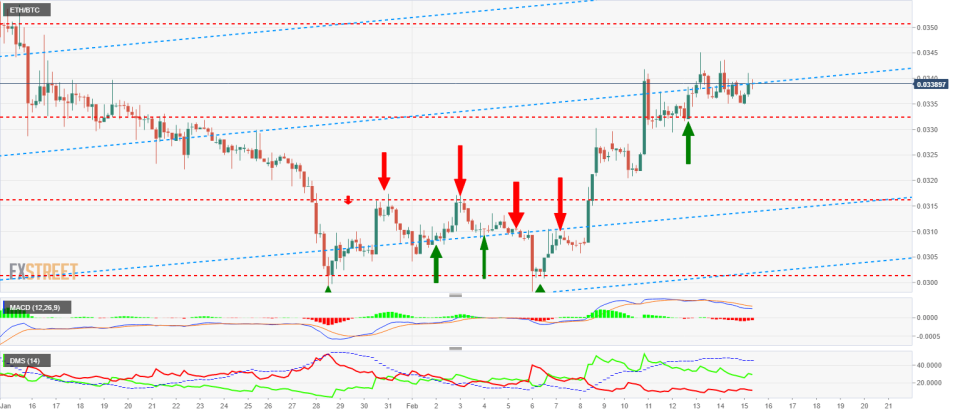
The board has been turning green as the Asian session advanced, and now the market rises timidly but at key levels that can give a sign of a bullish break.

A close at the ETH/BTC above 0.0338 would send a first hint, which would be confirmed by a close above 0.034342. From there, the rise should be generalized among all the main players in the sector, with Ethereum leading the upward movement, followed by Litecoin, Bitcoin and XRP.
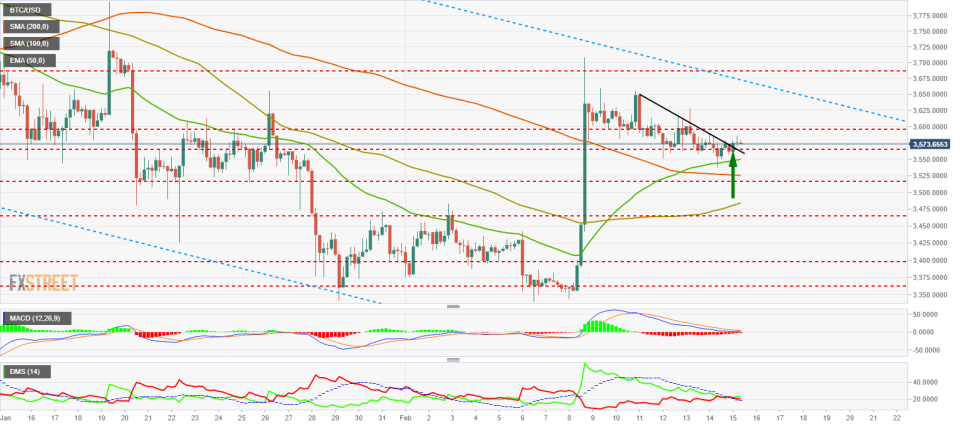
BTC/USD 240 Minute Chart
The BTC/USD pair is currently trading at the $3.578 price level and is heading towards the first price congestion resistance level of $3,600.
BTC/USD moves in the upper zone of the long term bearish channel and can break up the trend line that acts as the channel ceiling at the $3,650 price level. In the event of such a break, the next resistance level is $3,690 (price congestion resistance).
Below the current price, the first support level is at the $3,560 price level (price congestion support). Below this support level, there is a very crowded area where the EMA50 passes at $3,550 and the SMA200 at $3,525 and finally a congestion support price at $3,515, forming a potent area that should offer strong support to Bitcoin.

The MACD on the 4-hour chart presents a quasi-perfect bullish cross profile. The price has broken the short term trend and continues to be slightly optimistic, so it is likely that the bullish cross on the indicator will eventually occur.
The DMI on the 4-hour chart shows that bulls are slightly ahead of bears, but with so little difference that it would be effortless to turn around.
The general aspect is very confident in the short term, perhaps too good aspect, so those who trade in scalp mode would be recommended to adjust the stops as much as possible.
ETH/USD 240 Minute Chart
The ETH/USD is trading at the price level of $122.79, breaking the short term bearish trend line by a few cents. It is a very precarious technical signal that can be easily reversed.
Confirmation of the break would give it a close above the price level of $126.4, the recent high.
Above this price level, the next bullish target is $130.75 (price congestion resistance), then $142 (price congestion resistance) and finally $150 (price congestion resistance).
Below the current price, the first level of support is at $120 (price congestion support), a support that is greatly enhanced by the presence of the EMA50 at $118.65. The second level of support is at $115 (price congestion support), a level also greatly enhanced by the presence of the SMA200 at $115.46. Finally, at $112.5 the SMA100 would be the third level of support.

The MACD on the 4-hour chart does not show a bullish cut profile like the one we see on the Bitcoin, but the lines are very close together, and a bullish cross would be an easy task.
The DMI on the 4-hour chart shows us that bulls are keeping control although at slightly lower levels than in previous days. The bears, for their part, have increased activity slightly in recent hours but fail to threaten the dominance of the bulls.
XRP/USD 240 Minute Chart
The XRP/USD is currently trading at the $0.3040 price level, narrowly beating the short term bearish line. XRP broke this line a few hours ago, and the movement was rejected. To confirm, XRP/USD must close above the resistance level at $0.308 (price congestion resistance).
Below the current price, the first support level is immediately below the spot price with the SMA100 at $0.3034 and the EMA50 at $0.3032, bringing much strength to the price congestion support level at $0.300. The second support level is $0.2937 (price congestion support), then the third is $0.2886 (price congestion support).
Above the current price, the first resistance level is at $0.03083 (price congestion resistance), then the SMA200 at $0.3114 as a key level as this moving average has stopped the last three bullish cross attempts. The third resistance level is at $0.3173 (price congestion resistance), a level that if surpassed by the XRP/USD pair could trigger bullish euphoria.

The MACD on the 4-hour chart shows a very flat profile, lacking any direction or inertia. Any move will require a strong push to get the XRP chart back on track.
The DMI on the 4-hour chart shows bulls retaining control of the XRP/USD pair, although they have decreased in strength in recent hours. For their part, bears have attempted to take control of the moment, but the ADX line rejected it, good news for the bulls.
See more from Benzinga
© 2019 Benzinga.com. Benzinga does not provide investment advice. All rights reserved.

