Should You Be Tempted To Sell Vico International Holdings Limited (HKG:1621) Because Of Its P/E Ratio?

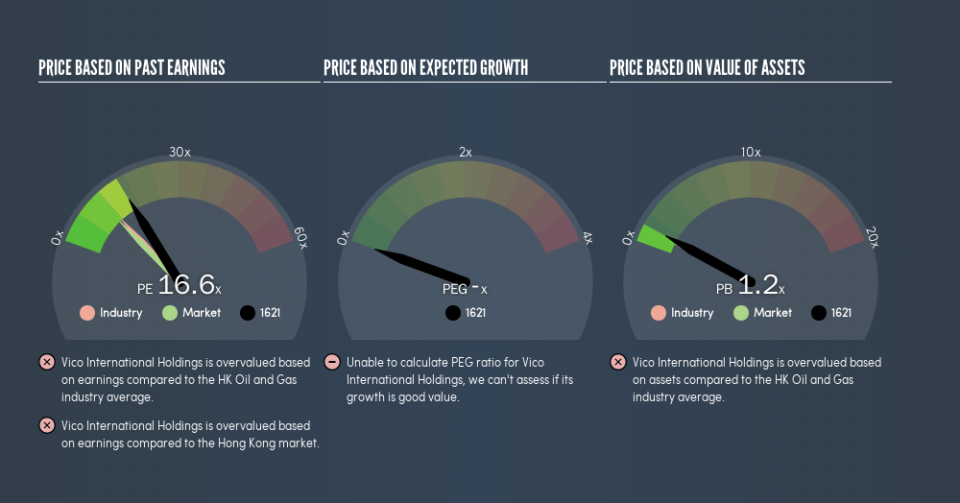
This article is for investors who would like to improve their understanding of price to earnings ratios (P/E ratios). We’ll show how you can use Vico International Holdings Limited’s (HKG:1621) P/E ratio to inform your assessment of the investment opportunity. Vico International Holdings has a price to earnings ratio of 16.55, based on the last twelve months. That is equivalent to an earnings yield of about 6.0%.
Check out our latest analysis for Vico International Holdings
How Do You Calculate A P/E Ratio?
The formula for P/E is:
Price to Earnings Ratio = Share Price ÷ Earnings per Share (EPS)
Or for Vico International Holdings:
P/E of 16.55 = HK$0.20 ÷ HK$0.012 (Based on the year to September 2018.)
Is A High Price-to-Earnings Ratio Good?
A higher P/E ratio means that investors are paying a higher price for each HK$1 of company earnings. That isn’t necessarily good or bad, but a high P/E implies relatively high expectations of what a company can achieve in the future.
How Growth Rates Impact P/E Ratios
Earnings growth rates have a big influence on P/E ratios. When earnings grow, the ‘E’ increases, over time. Therefore, even if you pay a high multiple of earnings now, that multiple will become lower in the future. Then, a lower P/E should attract more buyers, pushing the share price up.
Vico International Holdings’s earnings per share fell by 40% in the last twelve months. And EPS is down 18% a year, over the last 5 years. This could justify a pessimistic P/E.
How Does Vico International Holdings’s P/E Ratio Compare To Its Peers?
The P/E ratio indicates whether the market has higher or lower expectations of a company. As you can see below, Vico International Holdings has a higher P/E than the average company (11.7) in the oil and gas industry.
Its relatively high P/E ratio indicates that Vico International Holdings shareholders think it will perform better than other companies in its industry classification. The market is optimistic about the future, but that doesn’t guarantee future growth. So investors should delve deeper. I like to check if company insiders have been buying or selling.
A Limitation: P/E Ratios Ignore Debt and Cash In The Bank
Don’t forget that the P/E ratio considers market capitalization. In other words, it does not consider any debt or cash that the company may have on the balance sheet. In theory, a company can lower its future P/E ratio by using cash or debt to invest in growth.
Such spending might be good or bad, overall, but the key point here is that you need to look at debt to understand the P/E ratio in context.
Vico International Holdings’s Balance Sheet
The extra options and safety that comes with Vico International Holdings’s HK$24m net cash position means that it deserves a higher P/E than it would if it had a lot of net debt.
The Verdict On Vico International Holdings’s P/E Ratio
Vico International Holdings’s P/E is 16.6 which is above average (10.9) in the HK market. Falling earnings per share is probably keeping traditional value investors away, but the healthy balance sheet means the company retains potential for future growth. If fails to eventuate, the current high P/E could prove to be temporary, as the share price falls.
Investors should be looking to buy stocks that the market is wrong about. If the reality for a company is better than it expects, you can make money by buying and holding for the long term. We don’t have analyst forecasts, but you could get a better understanding of its growth by checking out this more detailed historical graph of earnings, revenue and cash flow.
Of course, you might find a fantastic investment by looking at a few good candidates. So take a peek at this free list of companies with modest (or no) debt, trading on a P/E below 20.
We aim to bring you long-term focused research analysis driven by fundamental data. Note that our analysis may not factor in the latest price-sensitive company announcements or qualitative material.
If you spot an error that warrants correction, please contact the editor at editorial-team@simplywallst.com. This article by Simply Wall St is general in nature. It does not constitute a recommendation to buy or sell any stock, and does not take account of your objectives, or your financial situation. Simply Wall St has no position in the stocks mentioned. Thank you for reading.
