Should You Be Tempted To Sell Old Dominion Freight Line, Inc. (NASDAQ:ODFL) Because Of Its P/E Ratio?

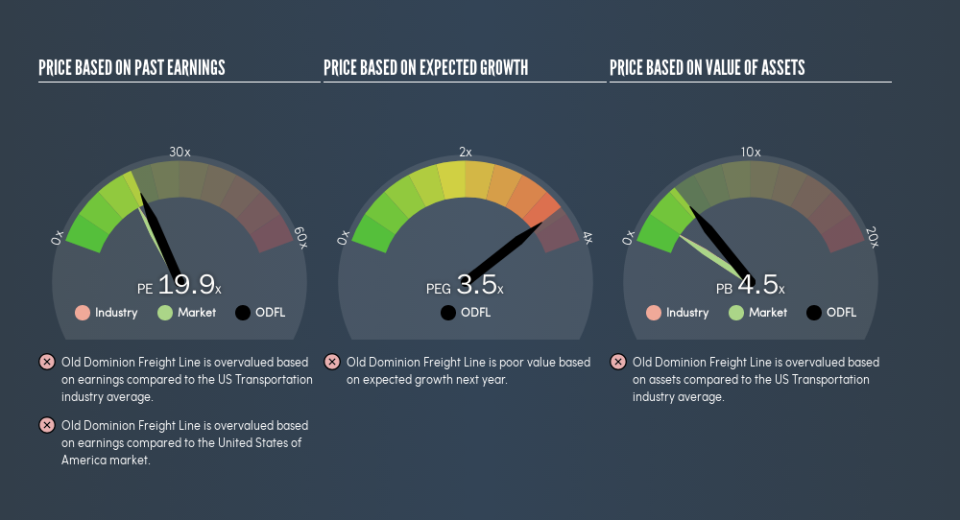
This article is written for those who want to get better at using price to earnings ratios (P/E ratios). We’ll look at Old Dominion Freight Line, Inc.’s (NASDAQ:ODFL) P/E ratio and reflect on what it tells us about the company’s share price. Based on the last twelve months, Old Dominion Freight Line’s P/E ratio is 19.9. That corresponds to an earnings yield of approximately 5.0%.
View our latest analysis for Old Dominion Freight Line
How Do I Calculate Old Dominion Freight Line’s Price To Earnings Ratio?
The formula for price to earnings is:
Price to Earnings Ratio = Price per Share ÷ Earnings per Share (EPS)
Or for Old Dominion Freight Line:
P/E of 19.9 = $147.14 ÷ $7.39 (Based on the trailing twelve months to December 2018.)
Is A High P/E Ratio Good?
A higher P/E ratio means that investors are paying a higher price for each $1 of company earnings. That isn’t a good or a bad thing on its own, but a high P/E means that buyers have a higher opinion of the business’s prospects, relative to stocks with a lower P/E.
How Growth Rates Impact P/E Ratios
P/E ratios primarily reflect market expectations around earnings growth rates. When earnings grow, the ‘E’ increases, over time. That means unless the share price increases, the P/E will reduce in a few years. So while a stock may look expensive based on past earnings, it could be cheap based on future earnings.
Old Dominion Freight Line increased earnings per share by a whopping 31% last year. And it has bolstered its earnings per share by 22% per year over the last five years. So we’d generally expect it to have a relatively high P/E ratio.
How Does Old Dominion Freight Line’s P/E Ratio Compare To Its Peers?
We can get an indication of market expectations by looking at the P/E ratio. As you can see below, Old Dominion Freight Line has a higher P/E than the average company (17.7) in the transportation industry.
That means that the market expects Old Dominion Freight Line will outperform other companies in its industry. Shareholders are clearly optimistic, but the future is always uncertain. So investors should delve deeper. I like to check if company insiders have been buying or selling.
Remember: P/E Ratios Don’t Consider The Balance Sheet
It’s important to note that the P/E ratio considers the market capitalization, not the enterprise value. Thus, the metric does not reflect cash or debt held by the company. Hypothetically, a company could reduce its future P/E ratio by spending its cash (or taking on debt) to achieve higher earnings.
Spending on growth might be good or bad a few years later, but the point is that the P/E ratio does not account for the option (or lack thereof).
How Does Old Dominion Freight Line’s Debt Impact Its P/E Ratio?
The extra options and safety that comes with Old Dominion Freight Line’s US$145m net cash position means that it deserves a higher P/E than it would if it had a lot of net debt.
The Bottom Line On Old Dominion Freight Line’s P/E Ratio
Old Dominion Freight Line trades on a P/E ratio of 19.9, which is above the US market average of 17.6. Its net cash position supports a higher P/E ratio, as does its solid recent earnings growth. So it does not seem strange that the P/E is above average.
Investors have an opportunity when market expectations about a stock are wrong. As value investor Benjamin Graham famously said, ‘In the short run, the market is a voting machine but in the long run, it is a weighing machine.’ So this free report on the analyst consensus forecasts could help you make a master move on this stock.
You might be able to find a better buy than Old Dominion Freight Line. If you want a selection of possible winners, check out this free list of interesting companies that trade on a P/E below 20 (but have proven they can grow earnings).
We aim to bring you long-term focused research analysis driven by fundamental data. Note that our analysis may not factor in the latest price-sensitive company announcements or qualitative material.
If you spot an error that warrants correction, please contact the editor at editorial-team@simplywallst.com. This article by Simply Wall St is general in nature. It does not constitute a recommendation to buy or sell any stock, and does not take account of your objectives, or your financial situation. Simply Wall St has no position in the stocks mentioned. Thank you for reading.

