Should You Be Tempted To Sell Isra Vision AG (ETR:ISR) Because Of Its P/E Ratio?

Want to participate in a research study? Help shape the future of investing tools and earn a $60 gift card!
This article is for investors who would like to improve their understanding of price to earnings ratios (P/E ratios). To keep it practical, we'll show how Isra Vision AG's (ETR:ISR) P/E ratio could help you assess the value on offer. Based on the last twelve months, Isra Vision's P/E ratio is 33.53. That means that at current prices, buyers pay €33.53 for every €1 in trailing yearly profits.
See our latest analysis for Isra Vision
How Do You Calculate A P/E Ratio?
The formula for P/E is:
Price to Earnings Ratio = Share Price ÷ Earnings per Share (EPS)
Or for Isra Vision:
P/E of 33.53 = €36.36 ÷ €1.08 (Based on the trailing twelve months to December 2018.)
Is A High Price-to-Earnings Ratio Good?
A higher P/E ratio implies that investors pay a higher price for the earning power of the business. That isn't a good or a bad thing on its own, but a high P/E means that buyers have a higher opinion of the business's prospects, relative to stocks with a lower P/E.
How Growth Rates Impact P/E Ratios
Probably the most important factor in determining what P/E a company trades on is the earnings growth. When earnings grow, the 'E' increases, over time. That means even if the current P/E is high, it will reduce over time if the share price stays flat. Then, a lower P/E should attract more buyers, pushing the share price up.
Most would be impressed by Isra Vision earnings growth of 13% in the last year. And its annual EPS growth rate over 5 years is 14%. This could arguably justify a relatively high P/E ratio.
How Does Isra Vision's P/E Ratio Compare To Its Peers?
The P/E ratio indicates whether the market has higher or lower expectations of a company. You can see in the image below that the average P/E (22.2) for companies in the electronic industry is lower than Isra Vision's P/E.
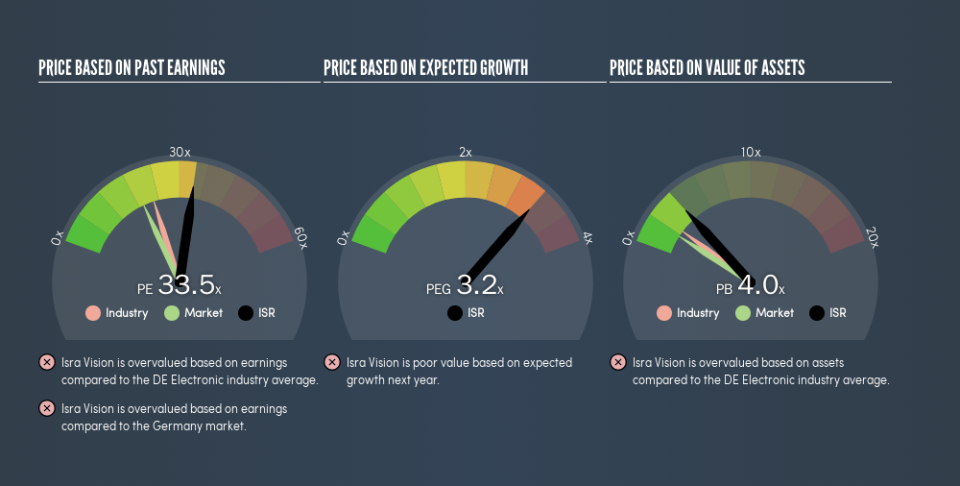
Its relatively high P/E ratio indicates that Isra Vision shareholders think it will perform better than other companies in its industry classification. The market is optimistic about the future, but that doesn't guarantee future growth. So investors should always consider the P/E ratio alongside other factors, such as whether company directors have been buying shares.
Don't Forget: The P/E Does Not Account For Debt or Bank Deposits
The 'Price' in P/E reflects the market capitalization of the company. In other words, it does not consider any debt or cash that the company may have on the balance sheet. Theoretically, a business can improve its earnings (and produce a lower P/E in the future), by taking on debt (or spending its remaining cash).
Such expenditure might be good or bad, in the long term, but the point here is that the balance sheet is not reflected by this ratio.
How Does Isra Vision's Debt Impact Its P/E Ratio?
Since Isra Vision holds net cash of €4.7m, it can spend on growth, justifying a higher P/E ratio than otherwise.
The Verdict On Isra Vision's P/E Ratio
Isra Vision has a P/E of 33.5. That's higher than the average in the DE market, which is 19.4. Its strong balance sheet gives the company plenty of resources for extra growth, and it has already proven it can grow. Therefore it seems reasonable that the market would have relatively high expectations of the company
When the market is wrong about a stock, it gives savvy investors an opportunity. As value investor Benjamin Graham famously said, 'In the short run, the market is a voting machine but in the long run, it is a weighing machine.' So this free visualization of the analyst consensus on future earnings could help you make the right decision about whether to buy, sell, or hold.
Of course, you might find a fantastic investment by looking at a few good candidates. So take a peek at this free list of companies with modest (or no) debt, trading on a P/E below 20.
We aim to bring you long-term focused research analysis driven by fundamental data. Note that our analysis may not factor in the latest price-sensitive company announcements or qualitative material.
If you spot an error that warrants correction, please contact the editor at editorial-team@simplywallst.com. This article by Simply Wall St is general in nature. It does not constitute a recommendation to buy or sell any stock, and does not take account of your objectives, or your financial situation. Simply Wall St has no position in the stocks mentioned. Thank you for reading.
