Read This Before You Buy Sakae Holdings Ltd. (SGX:5DO) Because Of Its P/E Ratio

Want to participate in a short research study? Help shape the future of investing tools and you could win a $250 gift card!
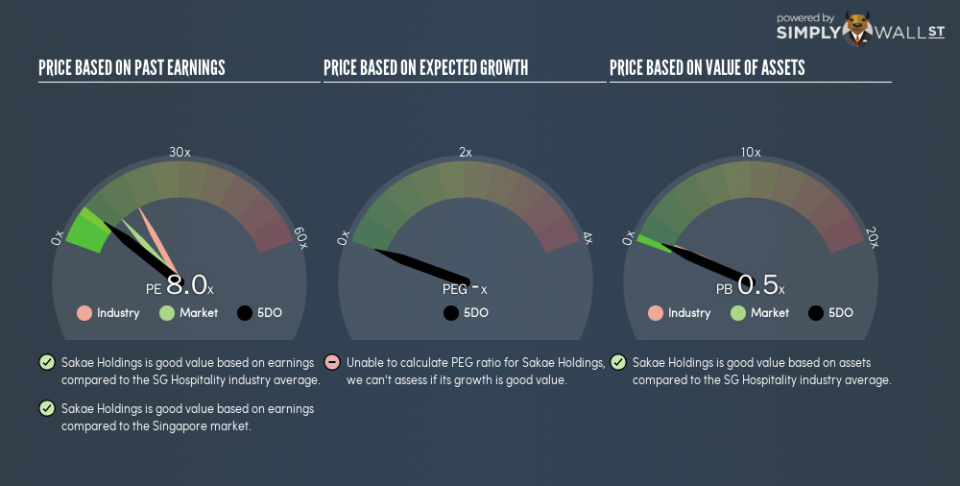
The goal of this article is to teach you how to use price to earnings ratios (P/E ratios). We’ll look at Sakae Holdings Ltd.’s (SGX:5DO) P/E ratio and reflect on what it tells us about the company’s share price. Based on the last twelve months, Sakae Holdings’s P/E ratio is 7.99. That corresponds to an earnings yield of approximately 13%.
View our latest analysis for Sakae Holdings
How Do You Calculate A P/E Ratio?
The formula for price to earnings is:
Price to Earnings Ratio = Price per Share ÷ Earnings per Share (EPS)
Or for Sakae Holdings:
P/E of 7.99 = SGD0.14 ÷ SGD0.018 (Based on the trailing twelve months to December 2018.)
Is A High Price-to-Earnings Ratio Good?
A higher P/E ratio means that buyers have to pay a higher price for each SGD1 the company has earned over the last year. All else being equal, it’s better to pay a low price — but as Warren Buffett said, ‘It’s far better to buy a wonderful company at a fair price than a fair company at a wonderful price.’
How Growth Rates Impact P/E Ratios
P/E ratios primarily reflect market expectations around earnings growth rates. When earnings grow, the ‘E’ increases, over time. Therefore, even if you pay a high multiple of earnings now, that multiple will become lower in the future. Then, a lower P/E should attract more buyers, pushing the share price up.
It’s nice to see that Sakae Holdings grew EPS by a stonking 138% in the last year. And its annual EPS growth rate over 3 years is 79%. With that performance, I would expect it to have an above average P/E ratio. But earnings per share are down 19% per year over the last five years.
How Does Sakae Holdings’s P/E Ratio Compare To Its Peers?
The P/E ratio indicates whether the market has higher or lower expectations of a company. The image below shows that Sakae Holdings has a lower P/E than the average (17.9) P/E for companies in the hospitality industry.
Its relatively low P/E ratio indicates that Sakae Holdings shareholders think it will struggle to do as well as other companies in its industry classification. Many investors like to buy stocks when the market is pessimistic about their prospects. It is arguably worth checking if insiders are buying shares, because that might imply they believe the stock is undervalued.
A Limitation: P/E Ratios Ignore Debt and Cash In The Bank
The ‘Price’ in P/E reflects the market capitalization of the company. That means it doesn’t take debt or cash into account. Hypothetically, a company could reduce its future P/E ratio by spending its cash (or taking on debt) to achieve higher earnings.
Such spending might be good or bad, overall, but the key point here is that you need to look at debt to understand the P/E ratio in context.
Is Debt Impacting Sakae Holdings’s P/E?
Sakae Holdings has net debt worth a very significant 246% of its market capitalization. This level of debt justifies a relatively low P/E, so remain cognizant of the debt, if you’re comparing it to other stocks.
The Bottom Line On Sakae Holdings’s P/E Ratio
Sakae Holdings’s P/E is 8 which is below average (11.9) in the SG market. While the EPS growth last year was strong, the significant debt levels reduce the number of options available to management. If it continues to grow, then the current low P/E may prove to be unjustified.
Investors have an opportunity when market expectations about a stock are wrong. As value investor Benjamin Graham famously said, ‘In the short run, the market is a voting machine but in the long run, it is a weighing machine.’ We don’t have analyst forecasts, but shareholders might want to examine this detailed historical graph of earnings, revenue and cash flow.
You might be able to find a better buy than Sakae Holdings. If you want a selection of possible winners, check out this free list of interesting companies that trade on a P/E below 20 (but have proven they can grow earnings).
To help readers see past the short term volatility of the financial market, we aim to bring you a long-term focused research analysis purely driven by fundamental data. Note that our analysis does not factor in the latest price-sensitive company announcements.
The author is an independent contributor and at the time of publication had no position in the stocks mentioned. For errors that warrant correction please contact the editor at editorial-team@simplywallst.com.
