Read This Before You Buy Gesco AG (ETR:GSC1) Because Of Its P/E Ratio

Want to participate in a short research study? Help shape the future of investing tools and receive a $20 prize!
This article is for investors who would like to improve their understanding of price to earnings ratios (P/E ratios). To keep it practical, we’ll show how Gesco AG’s (ETR:GSC1) P/E ratio could help you assess the value on offer. Gesco has a P/E ratio of 13.71, based on the last twelve months. That means that at current prices, buyers pay €13.71 for every €1 in trailing yearly profits.
View our latest analysis for Gesco
How Do You Calculate A P/E Ratio?
The formula for price to earnings is:
Price to Earnings Ratio = Share Price ÷ Earnings per Share (EPS)
Or for Gesco:
P/E of 13.71 = €24.6 ÷ €1.79 (Based on the trailing twelve months to December 2018.)
Is A High Price-to-Earnings Ratio Good?
A higher P/E ratio means that investors are paying a higher price for each €1 of company earnings. That isn’t necessarily good or bad, but a high P/E implies relatively high expectations of what a company can achieve in the future.
How Growth Rates Impact P/E Ratios
Earnings growth rates have a big influence on P/E ratios. Earnings growth means that in the future the ‘E’ will be higher. That means even if the current P/E is high, it will reduce over time if the share price stays flat. A lower P/E should indicate the stock is cheap relative to others — and that may attract buyers.
Notably, Gesco grew EPS by a whopping 32% in the last year. And it has improved its earnings per share by 5.8% per year over the last three years. With that performance, I would expect it to have an above average P/E ratio. But earnings per share are down 1.9% per year over the last five years.
How Does Gesco’s P/E Ratio Compare To Its Peers?
We can get an indication of market expectations by looking at the P/E ratio. The image below shows that Gesco has a lower P/E than the average (14.9) P/E for companies in the machinery industry.
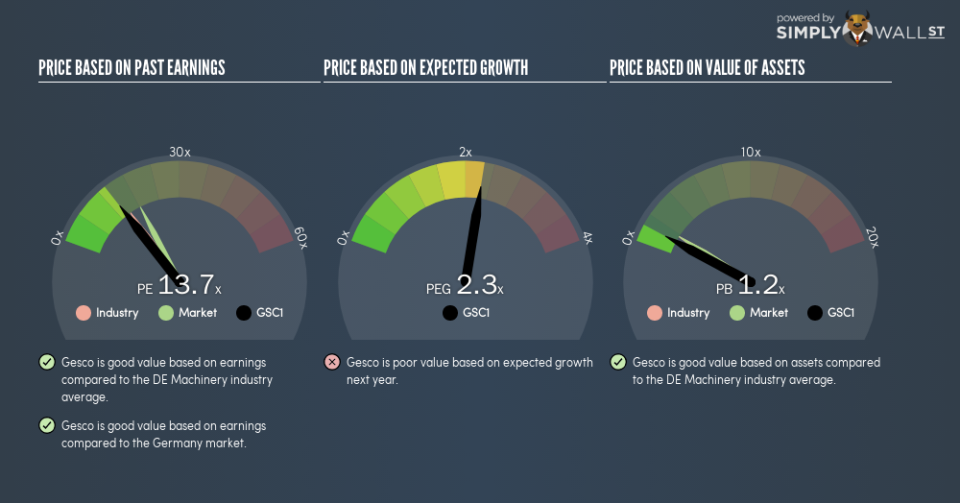
This suggests that market participants think Gesco will underperform other companies in its industry. While current expectations are low, the stock could be undervalued if the situation is better than the market assumes. If you consider the stock interesting, further research is recommended. For example, I often monitor director buying and selling.
Don’t Forget: The P/E Does Not Account For Debt or Bank Deposits
Don’t forget that the P/E ratio considers market capitalization. Thus, the metric does not reflect cash or debt held by the company. Hypothetically, a company could reduce its future P/E ratio by spending its cash (or taking on debt) to achieve higher earnings.
Spending on growth might be good or bad a few years later, but the point is that the P/E ratio does not account for the option (or lack thereof).
How Does Gesco’s Debt Impact Its P/E Ratio?
Gesco’s net debt is 41% of its market cap. This is a reasonably significant level of debt — all else being equal you’d expect a much lower P/E than if it had net cash.
The Verdict On Gesco’s P/E Ratio
Gesco has a P/E of 13.7. That’s below the average in the DE market, which is 18.2. The EPS growth last year was strong, and debt levels are quite reasonable. The low P/E ratio suggests current market expectations are muted, implying these levels of growth will not continue. Given analysts are expecting further growth, one might have expected a higher P/E ratio. That may be worth further research.
Investors should be looking to buy stocks that the market is wrong about. As value investor Benjamin Graham famously said, ‘In the short run, the market is a voting machine but in the long run, it is a weighing machine.’ So this free report on the analyst consensus forecasts could help you make a master move on this stock.
Of course you might be able to find a better stock than Gesco. So you may wish to see this free collection of other companies that have grown earnings strongly.
We aim to bring you long-term focused research analysis driven by fundamental data. Note that our analysis may not factor in the latest price-sensitive company announcements or qualitative material.
If you spot an error that warrants correction, please contact the editor at editorial-team@simplywallst.com. This article by Simply Wall St is general in nature. It does not constitute a recommendation to buy or sell any stock, and does not take account of your objectives, or your financial situation. Simply Wall St has no position in the stocks mentioned. On rare occasion, data errors may occur. Thank you for reading.

