Is Metlifecare Limited’s (NZE:MET) Balance Sheet A Threat To Its Future?

Investors are always looking for growth in small-cap stocks like Metlifecare Limited (NZSE:MET), with a market cap of NZ$1.24B. However, an important fact which most ignore is: how financially healthy is the business? Healthcare companies, even ones that are profitable, are inclined towards being higher risk. Assessing first and foremost the financial health is vital. I believe these basic checks tell most of the story you need to know. Though, this commentary is still very high-level, so I recommend you dig deeper yourself into MET here.
Does MET generate enough cash through operations?
MET has shrunken its total debt levels in the last twelve months, from NZ$80.80M to NZ$72.63M , which comprises of short- and long-term debt. With this reduction in debt, MET’s cash and short-term investments stands at NZ$2.93M for investing into the business. Moreover, MET has generated cash from operations of NZ$133.82M in the last twelve months, resulting in an operating cash to total debt ratio of 184.24%, signalling that MET’s current level of operating cash is high enough to cover debt. This ratio can also be a sign of operational efficiency as an alternative to return on assets. In MET’s case, it is able to generate 1.84x cash from its debt capital.
Does MET’s liquid assets cover its short-term commitments?
With current liabilities at NZ$156.24M, it seems that the business is not able to meet these obligations given the level of current assets of NZ$11.70M, with a current ratio of 0.075x below the prudent level of 3x.
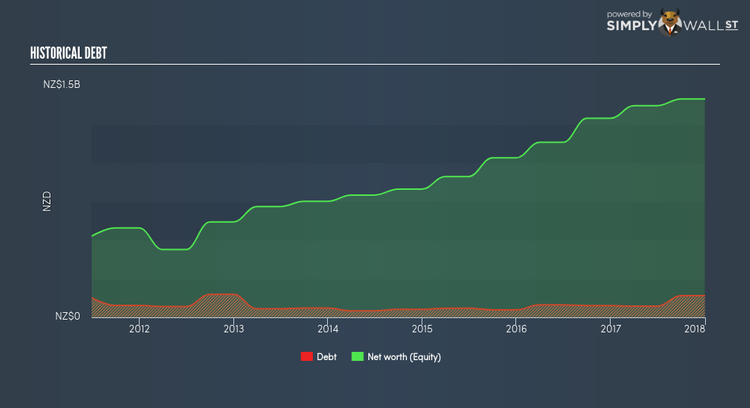
Does MET face the risk of succumbing to its debt-load?
With debt at 9.99% of equity, MET may be thought of as having low leverage. This range is considered safe as MET is not taking on too much debt obligation, which can be restrictive and risky for equity-holders. We can test if MET’s debt levels are sustainable by measuring interest payments against earnings of a company. Ideally, earnings before interest and tax (EBIT) should cover net interest by at least three times. For MET, the ratio of 5.15x suggests that interest is appropriately covered, which means that debtors may be willing to loan the company more money, giving MET ample headroom to grow its debt facilities.
Next Steps:
MET’s high cash coverage and conservative debt levels indicate its ability to utilise its borrowings efficiently in order to generate ample cash flow. But, as shareholders, you should try and determine whether this level of debt is justified for MET, especially if meeting short-term obligations could also bring about issues. I admit this is a fairly basic analysis for MET’s financial health. Other important fundamentals need to be considered alongside. I suggest you continue to research Metlifecare to get a more holistic view of the stock by looking at:
1. Future Outlook: What are well-informed industry analysts predicting for MET’s future growth? Take a look at our free research report of analyst consensus for MET’s outlook.
2. Historical Performance: What has MET’s returns been like over the past? Go into more detail in the past track record analysis and take a look at the free visual representations of our analysis for more clarity.
3. Other High-Performing Stocks: Are there other stocks that provide better prospects with proven track records? Explore our free list of these great stocks here.
To help readers see pass the short term volatility of the financial market, we aim to bring you a long-term focused research analysis purely driven by fundamental data. Note that our analysis does not factor in the latest price sensitive company announcements.
The author is an independent contributor and at the time of publication had no position in the stocks mentioned.
