Do You Know What Raffles United Holdings Ltd’s (SGX:K22) P/E Ratio Means?

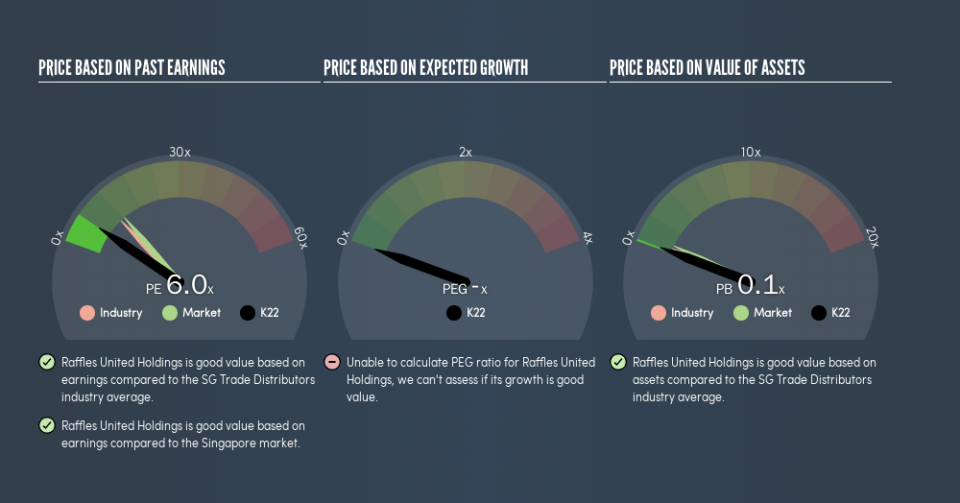
This article is for investors who would like to improve their understanding of price to earnings ratios (P/E ratios). We’ll look at Raffles United Holdings Ltd’s (SGX:K22) P/E ratio and reflect on what it tells us about the company’s share price. Based on the last twelve months, Raffles United Holdings’s P/E ratio is 6.02. In other words, at today’s prices, investors are paying SGD6.02 for every SGD1 in prior year profit.
See our latest analysis for Raffles United Holdings
How Do You Calculate A P/E Ratio?
The formula for P/E is:
Price to Earnings Ratio = Share Price ÷ Earnings per Share (EPS)
Or for Raffles United Holdings:
P/E of 6.02 = SGD0.047 ÷ SGD0.0078 (Based on the trailing twelve months to December 2018.)
Is A High Price-to-Earnings Ratio Good?
A higher P/E ratio means that buyers have to pay a higher price for each SGD1 the company has earned over the last year. All else being equal, it’s better to pay a low price — but as Warren Buffett said, ‘It’s far better to buy a wonderful company at a fair price than a fair company at a wonderful price.’
How Growth Rates Impact P/E Ratios
Earnings growth rates have a big influence on P/E ratios. When earnings grow, the ‘E’ increases, over time. That means unless the share price increases, the P/E will reduce in a few years. Then, a lower P/E should attract more buyers, pushing the share price up.
Raffles United Holdings saw earnings per share decrease by 46% last year. But it has grown its earnings per share by 61% per year over the last three years.
How Does Raffles United Holdings’s P/E Ratio Compare To Its Peers?
The P/E ratio essentially measures market expectations of a company. If you look at the image below, you can see Raffles United Holdings has a lower P/E than the average (11.3) in the trade distributors industry classification.
Its relatively low P/E ratio indicates that Raffles United Holdings shareholders think it will struggle to do as well as other companies in its industry classification. Since the market seems unimpressed with Raffles United Holdings, it’s quite possible it could surprise on the upside. You should delve deeper. I like to check if company insiders have been buying or selling.
Don’t Forget: The P/E Does Not Account For Debt or Bank Deposits
It’s important to note that the P/E ratio considers the market capitalization, not the enterprise value. That means it doesn’t take debt or cash into account. Hypothetically, a company could reduce its future P/E ratio by spending its cash (or taking on debt) to achieve higher earnings.
Spending on growth might be good or bad a few years later, but the point is that the P/E ratio does not account for the option (or lack thereof).
Raffles United Holdings’s Balance Sheet
Raffles United Holdings has net debt worth a very significant 240% of its market capitalization. This level of debt justifies a relatively low P/E, so remain cognizant of the debt, if you’re comparing it to other stocks.
The Bottom Line On Raffles United Holdings’s P/E Ratio
Raffles United Holdings’s P/E is 6 which is below average (12.6) in the SG market. Given meaningful debt, and a lack of recent growth, the market looks to be extrapolating this recent performance; reflecting low expectations for the future.
When the market is wrong about a stock, it gives savvy investors an opportunity. If it is underestimating a company, investors can make money by buying and holding the shares until the market corrects itself. Although we don’t have analyst forecasts, shareholders might want to examine this detailed historical graph of earnings, revenue and cash flow.
Of course, you might find a fantastic investment by looking at a few good candidates. So take a peek at this free list of companies with modest (or no) debt, trading on a P/E below 20.
We aim to bring you long-term focused research analysis driven by fundamental data. Note that our analysis may not factor in the latest price-sensitive company announcements or qualitative material.
If you spot an error that warrants correction, please contact the editor at editorial-team@simplywallst.com. This article by Simply Wall St is general in nature. It does not constitute a recommendation to buy or sell any stock, and does not take account of your objectives, or your financial situation. Simply Wall St has no position in the stocks mentioned. Thank you for reading.

