Do You Know What China Resources Gas Group Limited’s (HKG:1193) P/E Ratio Means?

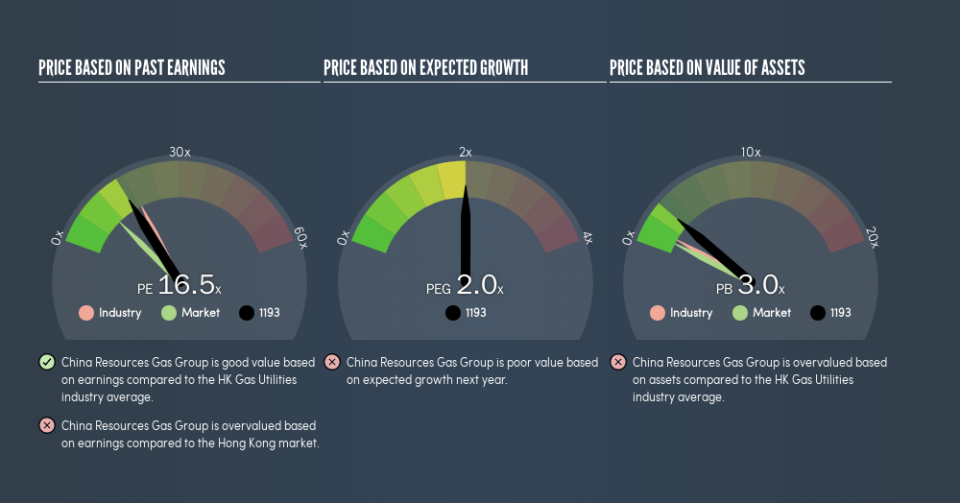
This article is for investors who would like to improve their understanding of price to earnings ratios (P/E ratios). To keep it practical, we’ll show how China Resources Gas Group Limited’s (HKG:1193) P/E ratio could help you assess the value on offer. Based on the last twelve months, China Resources Gas Group’s P/E ratio is 16.49. That corresponds to an earnings yield of approximately 6.1%.
View our latest analysis for China Resources Gas Group
How Do You Calculate China Resources Gas Group’s P/E Ratio?
The formula for price to earnings is:
Price to Earnings Ratio = Price per Share ÷ Earnings per Share (EPS)
Or for China Resources Gas Group:
P/E of 16.49 = HK$31.7 ÷ HK$1.92 (Based on the trailing twelve months to June 2018.)
Is A High P/E Ratio Good?
A higher P/E ratio implies that investors pay a higher price for the earning power of the business. That isn’t a good or a bad thing on its own, but a high P/E means that buyers have a higher opinion of the business’s prospects, relative to stocks with a lower P/E.
How Growth Rates Impact P/E Ratios
P/E ratios primarily reflect market expectations around earnings growth rates. That’s because companies that grow earnings per share quickly will rapidly increase the ‘E’ in the equation. That means unless the share price increases, the P/E will reduce in a few years. Then, a lower P/E should attract more buyers, pushing the share price up.
China Resources Gas Group increased earnings per share by an impressive 21% over the last twelve months. And earnings per share have improved by 14% annually, over the last five years. With that performance, you might expect an above average P/E ratio.
How Does China Resources Gas Group’s P/E Ratio Compare To Its Peers?
The P/E ratio indicates whether the market has higher or lower expectations of a company. If you look at the image below, you can see China Resources Gas Group has a lower P/E than the average (18.6) in the gas utilities industry classification.
China Resources Gas Group’s P/E tells us that market participants think it will not fare as well as its peers in the same industry. Many investors like to buy stocks when the market is pessimistic about their prospects. If you consider the stock interesting, further research is recommended. For example, I often monitor director buying and selling.
Remember: P/E Ratios Don’t Consider The Balance Sheet
It’s important to note that the P/E ratio considers the market capitalization, not the enterprise value. In other words, it does not consider any debt or cash that the company may have on the balance sheet. In theory, a company can lower its future P/E ratio by using cash or debt to invest in growth.
Spending on growth might be good or bad a few years later, but the point is that the P/E ratio does not account for the option (or lack thereof).
China Resources Gas Group’s Balance Sheet
The extra options and safety that comes with China Resources Gas Group’s HK$347m net cash position means that it deserves a higher P/E than it would if it had a lot of net debt.
The Bottom Line On China Resources Gas Group’s P/E Ratio
China Resources Gas Group trades on a P/E ratio of 16.5, which is above the HK market average of 10.8. Its net cash position supports a higher P/E ratio, as does its solid recent earnings growth. So it is not surprising the market is probably extrapolating recent growth well into the future, reflected in the relatively high P/E ratio.
Investors should be looking to buy stocks that the market is wrong about. As value investor Benjamin Graham famously said, ‘In the short run, the market is a voting machine but in the long run, it is a weighing machine.’ So this free visual report on analyst forecasts could hold the key to an excellent investment decision.
Of course you might be able to find a better stock than China Resources Gas Group. So you may wish to see this free collection of other companies that have grown earnings strongly.
We aim to bring you long-term focused research analysis driven by fundamental data. Note that our analysis may not factor in the latest price-sensitive company announcements or qualitative material.
If you spot an error that warrants correction, please contact the editor at editorial-team@simplywallst.com. This article by Simply Wall St is general in nature. It does not constitute a recommendation to buy or sell any stock, and does not take account of your objectives, or your financial situation. Simply Wall St has no position in the stocks mentioned. Thank you for reading.
