The Greenback Breaks Down amidst Trade-War Tension Roller-Coaster
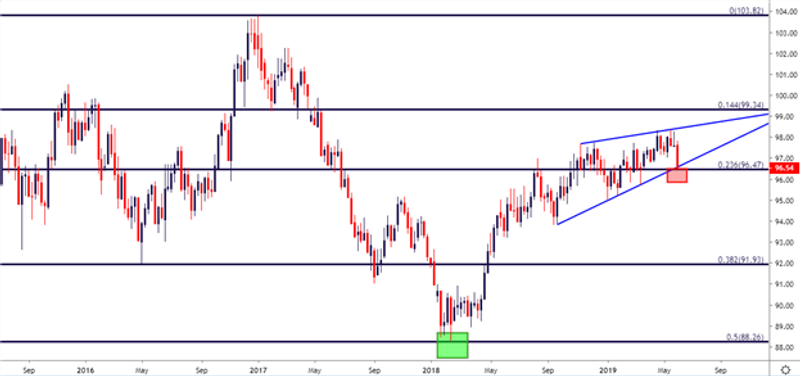
Over the past few weeks the ascending triangle of the Greenback has risen due to a bullish breakout attempting to increase the horizon to new heights, which subsequently was only temporarily successful and followed by prices dropping back down to their prior figures.
Now as things stand the US Dollar has formed a wedge formation within the data analysis; which has seen a flat-line forwards continued by an upward market trend. This development could potentially open the door for long-term short side increases in the US Dollar.
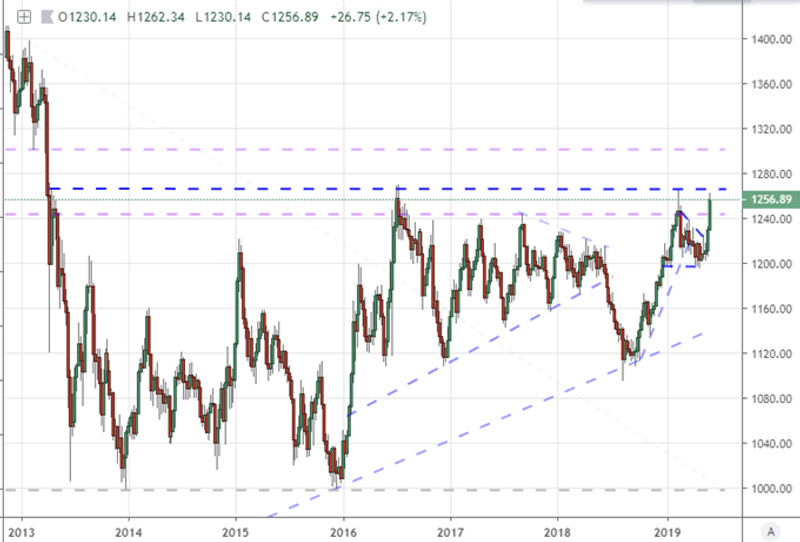
Gold rallied at 2.7% last week for a consecutive eight day high, the largest success rates since April 2019. Gold prices have managed to rise increasingly amidst trade war tensions, due to the support of crumbling yield bonds. Gold value has managed to remain high seeing rates maintain their 2019 peak, as currency values struggled to recover from plummeting results.
It’s likely that Gold will continue to shine throughout the up-and-coming weeks as the flow of trade news continues to impact the fall of currency markets. It is difficult to predict stability until a trade agreement is reached, however until the narrative moves forward Gold is likely to lustre throughout the foreseeable weeks ahead.
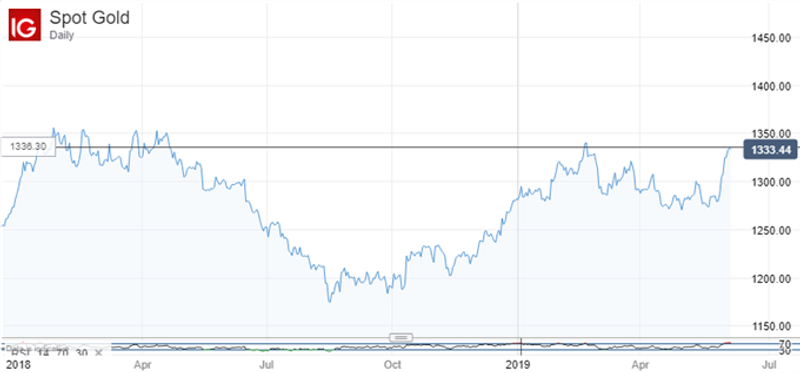
Whilst currently on a winning streak this leaves Gold in a place of vulnerability, with the potential for an enormous market reversal moving forward over the next few months. Whilst aggressive bulls have attempted to increase the value of the Greenback this has now lost momentum. Moving forward it is unclear what is in store whilst the trade war continues to impact market values and the roller coaster of financial uncertainty dominates. This hasn’t happened in years and whilst the range top is evident within the diagram below, trading against it at this moment would be a brash decision as fundamental developments have yet to take place. At the time of writing Gold is trading $1329.
ICE FX has a wealth of online resources available for new and experienced traders to assist with making smart financial investments within the Forex Market. Our resources offer; accessible, clear, online support to ensure you are able to guide yourself through the process armed with all the knowledge and skills that you need.
This article was originally posted on FX Empire
