Gold Price Futures (GC) Technical Analysis – Needs to Clear Wall of Resistance at $1200.00 to $1205.90 to Sustain Short-Covering Rally
December Comex Gold futures closed higher on Friday, reversing earlier weakness which drove the market to nearly a 6-week low. Short-covering and profit-taking helped drive prices higher, but the catalyst behind the move was a strong rally in silver. Despite expectations of rising interest rates and a firmer U.S. Dollar, which are keeping a lid on prices, gold traders may start paying more attention to the price action in silver. So keep that in mind this week.
Daily Swing Chart Technical Analysis
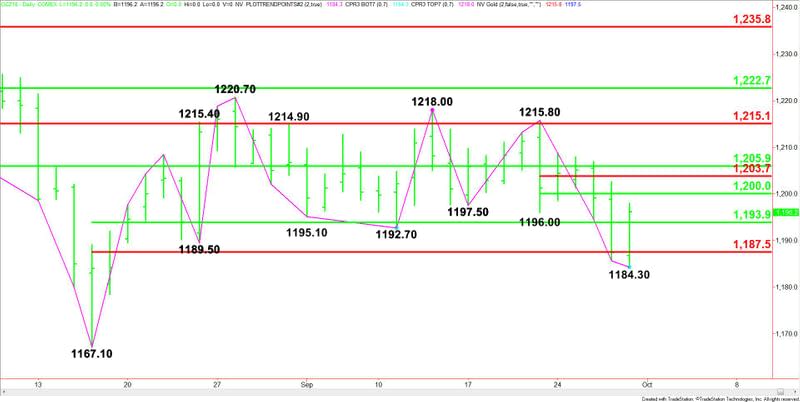
The main trend is down according to the daily swing chart. However, Friday’s closing price reversal bottom may be an early sign that momentum may be getting ready to shift to the upside. A trade through $1198.00 will confirm the reversal bottom. If buyers come in on the confirmation then look for a possible 2 to 3 day counter-trend rally.
The main trend changes to up on a trade through $1215.80. A move through $1184.30 will negate the closing price reversal bottom and signal a resumption of the downtrend with $1167.10 the next major target.
The main range is $1167.10 to $1220.70. Its retracement zone at $1193.90 to $1187.50 is a key area to watch. Based on Friday’s close, it begins today’s session as support.
The short-term range is $1215.80 to $1184.30. Its retracement zone at $1200.00 to $1203.70 is the first upside target. The second target is a longer-term retracement zone at $1205.90 to $1215.10.
Daily Swing Chart Technical Forecast
Based on Friday’s close at $1196.20 and the price action, the direction of the December Comex Gold futures contract on Monday is likely to be determined by trader reaction to the 50% level at $1193.90.
A sustained move over $1193.90 will indicate the presence of buyers. If this creates enough upside momentum then look for a labored rally with potential targets coming in at $1200.00, $1203.70 and $1205.90.
The rally will pick up strength over $1205.90 with $1215.10 the next likely target.
A sustained move under $1193.90 will signal the presence of sellers. This could lead to an extension of the selling into $1187.50. If this price fails then look for a test of $1184.30. This price is a potential trigger point for an acceleration to the downside with $1167.10 the next major target.
This article was originally posted on FX Empire

