Gold Price Futures (GC) Technical Analysis – January 2, 2019 Forecast
Gold is trading higher on Wednesday, supported by safe-haven buying. Investors bought gold after weaker-than-expected Chinese manufacturing data showed a contraction for the first time in 19 months. The news triggered a steep break in stock index futures which increased demand for gold. Traders were also pricing in the possibility of a global recession. This would put pressure on interest rates, which would be supportive for gold prices.
At 1508 GMT, February Comex gold is trading $1286.30, up $5.00 or 0.40%.
Although gold surged to the upside, gains were capped by a rebound in the U.S. Dollar. Traders should monitor this relationship because gold will have trouble rallying if the dollar continues to strengthen.
Daily Technical Analysis
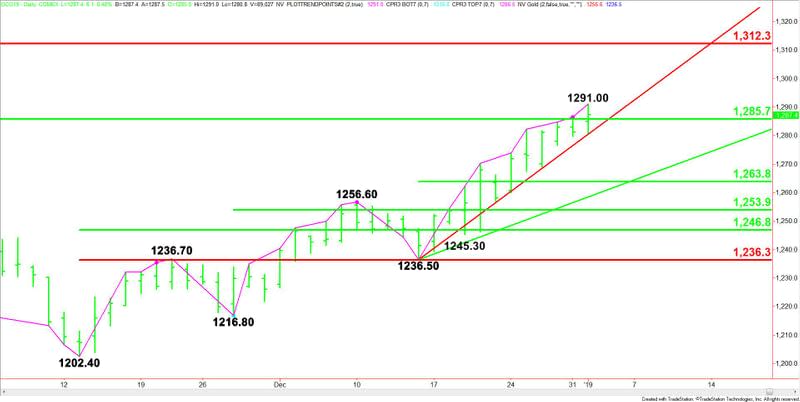
The main trend is up according to the daily swing chart. The uptrend was reaffirmed early in the session when buyers took out the closing price reversal top at $1286.50. The market is in no position to change the main trend to down, but it remains inside the window of time for a potentially bearish closing price reversal top.
Gold is currently trading inside a major retracement zone at $1285.70 to $1312.30. This zone can stop a rally while at the same time there is plenty of room to the upside if the buying continues.
The short-term range is $1236.50 to $1291.00. Its 50% level at $1263.80 is the first downside target.
The intermediate range is $1216.80 to $1291.00. Its 50% level at $1253.90 is the next downside target.
Daily Technical Forecast
Based on the early price action and the current price at $1286.30, the direction of the February Comex gold futures contract the rest of the session is likely to be determined by trader reaction to the 50% level at $1285.70.
Bullish Scenario
A sustained move over $1285.70 will indicate the presence of buyers. This could trigger a retest of today’s high at $1291.00. This is a potential trigger point for an acceleration to the upside with $1312.30 the next major upside target.
Bearish Scenario
A sustained move under $1285.70 will signal the presence of sellers. The next downside target is a steep uptrending Gann angle at $1280.50. This angle has guided the market higher since the $1236.50 main bottom on December 14.
The daily chart indicates there is plenty of room to the downside under $1280.50. The first major downside target comes in at $1263.80, followed by an uptrending Gann angle at $1258.50 and another 50% level at $1254.20.
This article was originally posted on FX Empire

