Gold Price Futures (GC) Technical Analysis – Opens Week on Bullish Side of Major Retracement Zone
Gold futures finished higher last week despite a surge in the U.S. Dollar against a basket of currencies, higher Treasury yields and increased appetite for risk. The steep drop in the Euro may have had something to do with strength in the gold market.
Furthermore, concerns over a weakening U.S. economy, driven by a dismal retail sales report and a drop in factory activity may have also been supportive. We could have also seen early buying ahead of the Fed minutes, which are scheduled to be released on Wednesday. These minutes are expected to show why the Fed flipped to dovish from December’s hawkish monetary policy statement.
Last week, April Comex gold settled at $1322.10, up $3.60 or +0.27%.
Weekly Technical Analysis
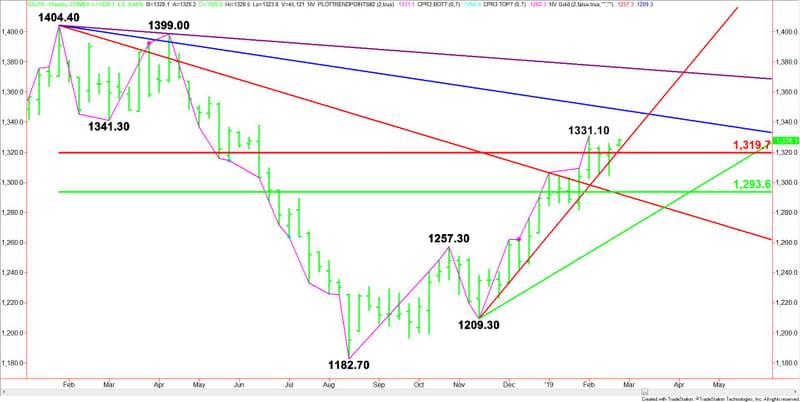
The main trend is up according to the weekly swing chart. A trade through $1331.10 will signal a resumption of the uptrend. The uptrend is safe for now, but due to the prolonged move up in terms of price and time, the market remains vulnerable to a potentially bearish closing price reversal top.
The main range is $1404.40 to $1182.70. Its retracement zone at $1293.60 to $1319.70 is controlling the longer-term direction of the market.
Weekly Technical Forecast
Based on last week’s close at $1322.10, the direction of the April Comex gold futures contract this week is likely to be determined by trader reaction to the major Fibonacci level at $1319.70.
Bullish Scenario
A sustained move over $1319.70 will indicate the presence of buyers. Holding above the uptrending Gann angle at $1321.30 will indicate the buying is getting stronger. If this creates enough upside momentum then look for a move into the recent high at $1331.10.
Taking out $1331.10 will indicate the buying is getting stronger. This could trigger an acceleration to the upside with the next target angle coming in at $1348.40. Look for a technical bounce on the first test of this angle, but watch for an acceleration to the upside if this angle is taken out with strong volume. This could drive the market into the next target angle at $1376.40.
Bearish Scenario
A failure to hold above $1321.30 will be the first sign of weakness. Crossing to the weak side of the Fibonacci level at $1319.70 will indicate the selling is getting stronger. If the selling volume increases then look for a potential break back into the major 50% level at $1293.60.
This article was originally posted on FX Empire

