Gold Price Futures (GC) Technical Analysis – Testing Major Retracement Zone at $1293.60 to $1319.70
Gold futures finished sharply lower last week after a steep rise in U.S. Treasury yields helped make the U.S. Dollar a more attractive investment. The stronger U.S. Dollar then drove down foreign demand for dollar-denominated gold. The catalyst behind the rise in yields was optimism over a U.S.-China trade deal and a stronger-than-expected U.S. Gross Domestic Product report that raised the chances of a Fed rate hike later in the year.
Last week, April Comex gold settled at $1299.20, down $33.60 or -2.52%.
Weekly Technical Analysis
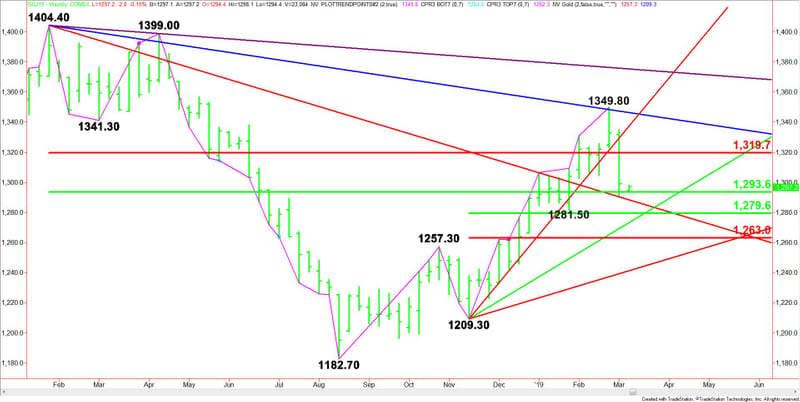
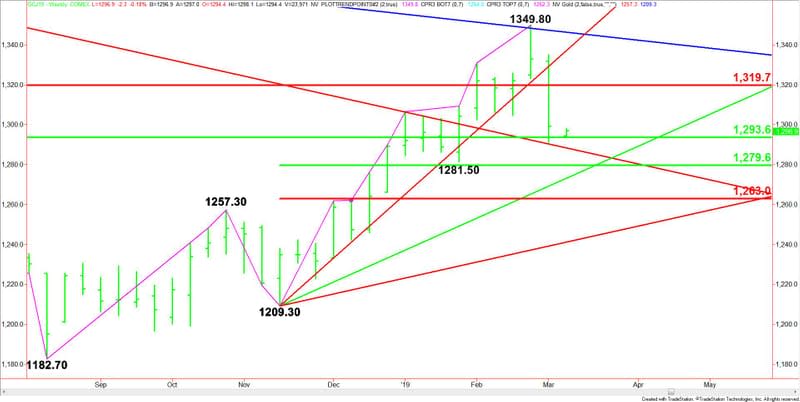
The main trend is up according to the weekly swing chart. A trade through $1349.80 will signal a resumption of the uptrend. The main trend will change to down on a move through $1209.30.
The minor trend is also up. A trade through $1281.50 will change the minor trend to down. This will also shift momentum to the downside.
The major retracement zone controlling the near-term direction of the gold market comes in at $1293.60 to $1319.70. The market is currently trading inside this zone.
The short-term range is $1209.30 to $1349.80. If the selling pressure continues then look for a break into its retracement zone at $1279.60 to $1263.00. Since the main trend is up, buyers are likely to come in on a test of this zone.
Weekly Technical Forecast
Based on last week’s close at $1299.20, the direction of the April Comex gold futures contract this week is likely to be determined by trader reaction to $1293.60.
Bullish Scenario
A sustained move over $1293.60 will indicate the presence of buyers. If this creates enough upside momentum then look for a potential rally into the Fibonacci level at $1319.70.
Bearish Scenario
A sustained move under $1293.60 will signal the presence of sellers. The first target is the downtrending Gann angle at $1288.40. Crossing to the weak side of this angle will indicate the selling is getting stronger. This could trigger a further decline into the short-term 50% level at $1279.60.
If $1279.60 fails as support then look for the selling to extend into an uptrending Gann angle at $1273.30. Watch for a technical bounce on the first test of this angle. If it fails then look for a move into the short-term Fibonacci level at $1263.00.
This article was originally posted on FX Empire
More From FXEMPIRE:
USD/CAD Daily Price Forecast – Upside Move Influenced By Upbeat US T.Yields
EUR/USD Price Forecast – Pair Trades Dovish For Thrid Consecutive Session on Strong USD
Bitcoin Cash – ABC, Litecoin and Ripple Daily Analysis – 05/03/19
Bitcoin And Ethereum Daily Price Forecast – Major Crypto Coins Bleed Red
