Do You Like FY Financial (Shenzhen) Co., Ltd. (HKG:8452) At This P/E Ratio?

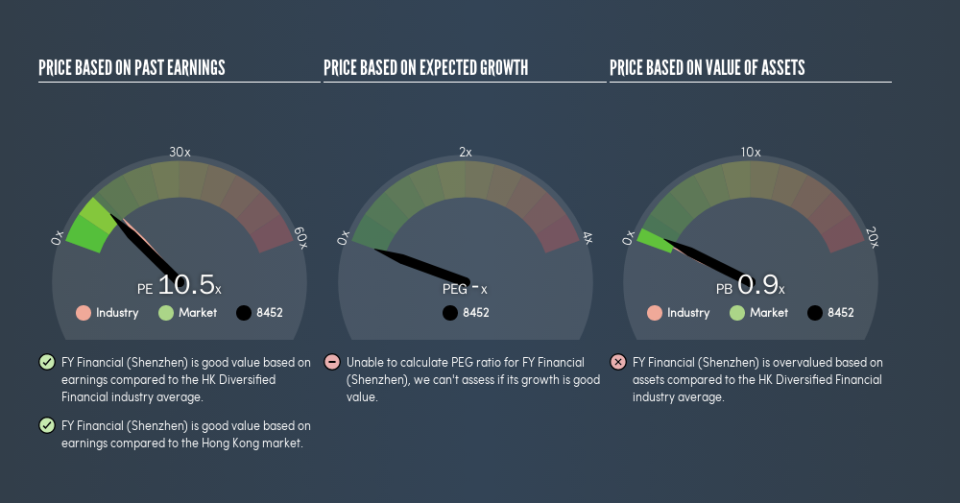
This article is written for those who want to get better at using price to earnings ratios (P/E ratios). We’ll look at FY Financial (Shenzhen) Co., Ltd.’s (HKG:8452) P/E ratio and reflect on what it tells us about the company’s share price. FY Financial (Shenzhen) has a P/E ratio of 10.55, based on the last twelve months. That is equivalent to an earnings yield of about 9.5%.
See our latest analysis for FY Financial (Shenzhen)
How Do I Calculate A Price To Earnings Ratio?
The formula for P/E is:
Price to Earnings Ratio = Share Price (in reporting currency) ÷ Earnings per Share (EPS)
Or for FY Financial (Shenzhen):
P/E of 10.55 = CN¥1.18 (Note: this is the share price in the reporting currency, namely, CNY ) ÷ CN¥0.11 (Based on the trailing twelve months to December 2018.)
Is A High P/E Ratio Good?
A higher P/E ratio means that investors are paying a higher price for each HK$1 of company earnings. That isn’t a good or a bad thing on its own, but a high P/E means that buyers have a higher opinion of the business’s prospects, relative to stocks with a lower P/E.
How Growth Rates Impact P/E Ratios
P/E ratios primarily reflect market expectations around earnings growth rates. When earnings grow, the ‘E’ increases, over time. That means even if the current P/E is high, it will reduce over time if the share price stays flat. A lower P/E should indicate the stock is cheap relative to others — and that may attract buyers.
FY Financial (Shenzhen) increased earnings per share by a whopping 75% last year. And it has improved its earnings per share by 53% per year over the last three years. With that performance, I would expect it to have an above average P/E ratio.
How Does FY Financial (Shenzhen)’s P/E Ratio Compare To Its Peers?
The P/E ratio essentially measures market expectations of a company. If you look at the image below, you can see FY Financial (Shenzhen) has a lower P/E than the average (12.2) in the diversified financial industry classification.
FY Financial (Shenzhen)’s P/E tells us that market participants think it will not fare as well as its peers in the same industry. While current expectations are low, the stock could be undervalued if the situation is better than the market assumes. You should delve deeper. I like to check if company insiders have been buying or selling.
A Limitation: P/E Ratios Ignore Debt and Cash In The Bank
Don’t forget that the P/E ratio considers market capitalization. Thus, the metric does not reflect cash or debt held by the company. Hypothetically, a company could reduce its future P/E ratio by spending its cash (or taking on debt) to achieve higher earnings.
Spending on growth might be good or bad a few years later, but the point is that the P/E ratio does not account for the option (or lack thereof).
How Does FY Financial (Shenzhen)’s Debt Impact Its P/E Ratio?
Net debt totals a substantial 173% of FY Financial (Shenzhen)’s market cap. If you want to compare its P/E ratio to other companies, you must keep in mind that these debt levels would usually warrant a relatively low P/E.
The Bottom Line On FY Financial (Shenzhen)’s P/E Ratio
FY Financial (Shenzhen)’s P/E is 10.5 which is about average (10.8) in the HK market. It does have enough debt to add risk, although earnings growth was strong in the last year. However, the P/E ratio implies that most doubt the strong growth will continue.
Investors should be looking to buy stocks that the market is wrong about. If the reality for a company is not as bad as the P/E ratio indicates, then the share price should increase as the market realizes this. Although we don’t have analyst forecasts, shareholders might want to examine this detailed historical graph of earnings, revenue and cash flow.
Of course you might be able to find a better stock than FY Financial (Shenzhen). So you may wish to see this free collection of other companies that have grown earnings strongly.
We aim to bring you long-term focused research analysis driven by fundamental data. Note that our analysis may not factor in the latest price-sensitive company announcements or qualitative material.
If you spot an error that warrants correction, please contact the editor at editorial-team@simplywallst.com. This article by Simply Wall St is general in nature. It does not constitute a recommendation to buy or sell any stock, and does not take account of your objectives, or your financial situation. Simply Wall St has no position in the stocks mentioned. Thank you for reading.
