Here’s What Evonik Industries AG’s (FRA:EVK) P/E Ratio Is Telling Us

The goal of this article is to teach you how to use price to earnings ratios (P/E ratios). We’ll look at Evonik Industries AG’s (FRA:EVK) P/E ratio and reflect on what it tells us about the company’s share price. Based on the last twelve months, Evonik Industries’s P/E ratio is 13.03. In other words, at today’s prices, investors are paying €13.03 for every €1 in prior year profit.
View our latest analysis for Evonik Industries
How Do You Calculate Evonik Industries’s P/E Ratio?
The formula for price to earnings is:
Price to Earnings Ratio = Price per Share ÷ Earnings per Share (EPS)
Or for Evonik Industries:
P/E of 13.03 = €26 ÷ €2 (Based on the trailing twelve months to December 2018.)
Is A High Price-to-Earnings Ratio Good?
A higher P/E ratio means that buyers have to pay a higher price for each €1 the company has earned over the last year. That isn’t necessarily good or bad, but a high P/E implies relatively high expectations of what a company can achieve in the future.
How Growth Rates Impact P/E Ratios
Probably the most important factor in determining what P/E a company trades on is the earnings growth. Earnings growth means that in the future the ‘E’ will be higher. That means even if the current P/E is high, it will reduce over time if the share price stays flat. A lower P/E should indicate the stock is cheap relative to others — and that may attract buyers.
Evonik Industries increased earnings per share by a whopping 30% last year. And earnings per share have improved by 8.5% annually, over the last five years. I’d therefore be a little surprised if its P/E ratio was not relatively high.
How Does Evonik Industries’s P/E Ratio Compare To Its Peers?
We can get an indication of market expectations by looking at the P/E ratio. The image below shows that Evonik Industries has a lower P/E than the average (16.3) P/E for companies in the chemicals industry.
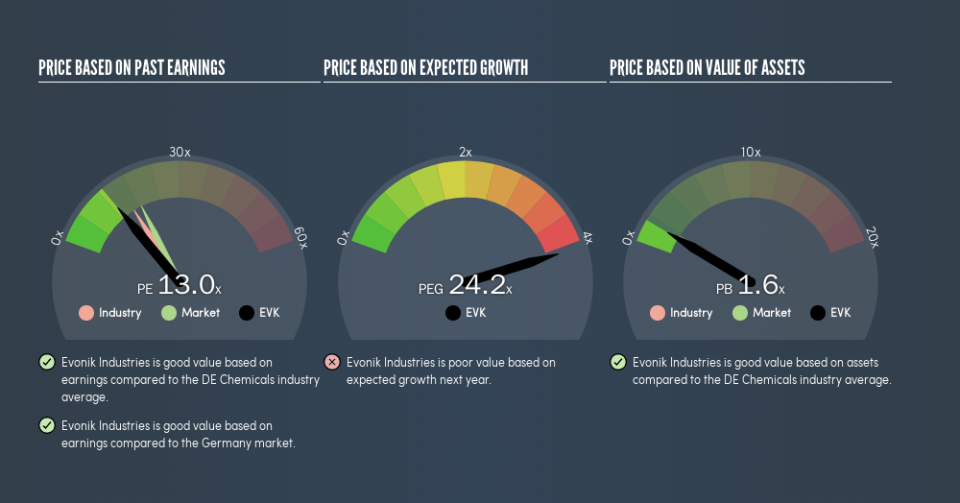
This suggests that market participants think Evonik Industries will underperform other companies in its industry. Many investors like to buy stocks when the market is pessimistic about their prospects. You should delve deeper. I like to check if company insiders have been buying or selling.
Remember: P/E Ratios Don’t Consider The Balance Sheet
It’s important to note that the P/E ratio considers the market capitalization, not the enterprise value. In other words, it does not consider any debt or cash that the company may have on the balance sheet. Hypothetically, a company could reduce its future P/E ratio by spending its cash (or taking on debt) to achieve higher earnings.
Such expenditure might be good or bad, in the long term, but the point here is that the balance sheet is not reflected by this ratio.
Is Debt Impacting Evonik Industries’s P/E?
Evonik Industries’s net debt is 21% of its market cap. That’s enough debt to impact the P/E ratio a little; so keep it in mind if you’re comparing it to companies without debt.
The Verdict On Evonik Industries’s P/E Ratio
Evonik Industries has a P/E of 13. That’s below the average in the DE market, which is 18.7. The company hasn’t stretched its balance sheet, and earnings growth was good last year. The low P/E ratio suggests current market expectations are muted, implying these levels of growth will not continue.
Investors should be looking to buy stocks that the market is wrong about. If the reality for a company is not as bad as the P/E ratio indicates, then the share price should increase as the market realizes this. So this free visual report on analyst forecasts could hold the key to an excellent investment decision.
Of course you might be able to find a better stock than Evonik Industries. So you may wish to see this free collection of other companies that have grown earnings strongly.
We aim to bring you long-term focused research analysis driven by fundamental data. Note that our analysis may not factor in the latest price-sensitive company announcements or qualitative material.
If you spot an error that warrants correction, please contact the editor at editorial-team@simplywallst.com. This article by Simply Wall St is general in nature. It does not constitute a recommendation to buy or sell any stock, and does not take account of your objectives, or your financial situation. Simply Wall St has no position in the stocks mentioned. Thank you for reading.
